Fig. 17
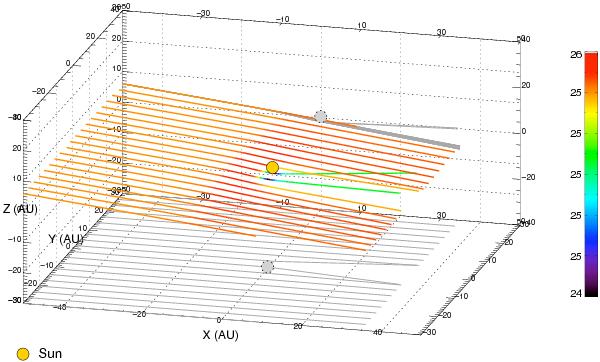
3D-representation of a “sheet” of particle trajectories with β = 1.0 and Q/m = 0.5 C/kg, during the focusing phase of the solar cycle. The start year is 2000. The “sheet” of particles is started along the Y-axis of the ISD frame. The focusing towards the solar ecliptic plane is visible, but at the same time there is a “defocusing” in the XY-plane (see projection), downstream of the Sun. The color denotes the particle speed in km s-1.
Current usage metrics show cumulative count of Article Views (full-text article views including HTML views, PDF and ePub downloads, according to the available data) and Abstracts Views on Vision4Press platform.
Data correspond to usage on the plateform after 2015. The current usage metrics is available 48-96 hours after online publication and is updated daily on week days.
Initial download of the metrics may take a while.