Fig. 4
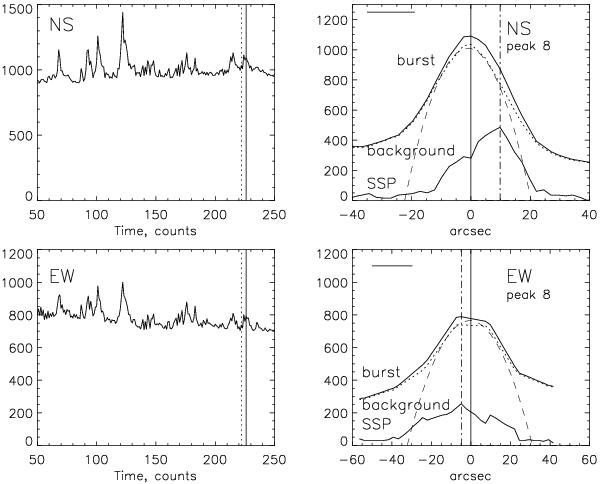
Left: the time intensity profiles obtained from one-dimensional scans. Right: the one-dimensional NS and EW scans during the pulse 8: positions of the spike sources in intensity distributions relative to the background burst source (dotted line). The background burst scan was approximated by the Gaussian distribution (dashed line) to determine accurately the position of the burst maximum. The horizontal bar at the top shows the size of the point source at the spatial half-width. Profile magnitudes are in arbitrary units.
Current usage metrics show cumulative count of Article Views (full-text article views including HTML views, PDF and ePub downloads, according to the available data) and Abstracts Views on Vision4Press platform.
Data correspond to usage on the plateform after 2015. The current usage metrics is available 48-96 hours after online publication and is updated daily on week days.
Initial download of the metrics may take a while.