Fig. 2
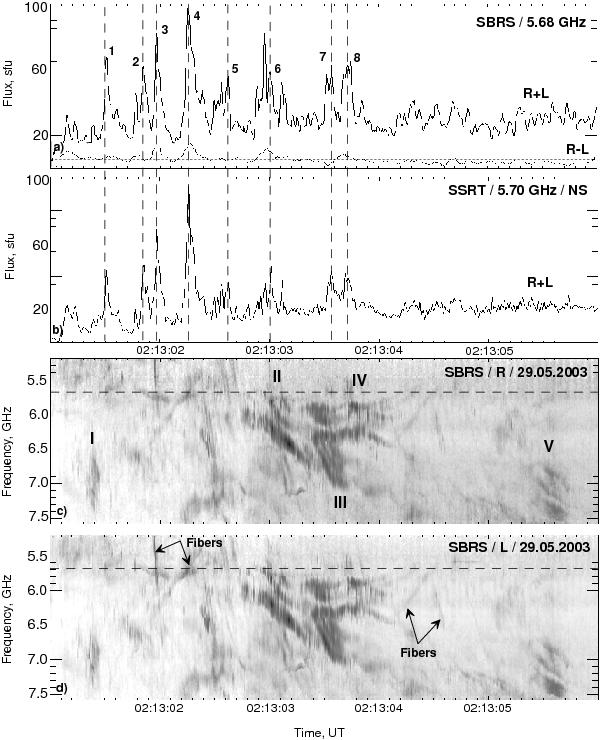
Comparison of the time profiles recorded at SBRS a) and SSRT b) and the dynamic spectrum (c), (d) registered by the SBRS spectropolarimeter. The dark details correspond to the increased emission. The horizontal dashed line c) denotes the SSRT receiving frequency at 5.7 GHz. The calibration was performed using the SSRT-registered background burst. Arabic numerals (a), b), dashed vertical lines) mark the maximum moments of subsecond pulses recorded by the SSRT.
Current usage metrics show cumulative count of Article Views (full-text article views including HTML views, PDF and ePub downloads, according to the available data) and Abstracts Views on Vision4Press platform.
Data correspond to usage on the plateform after 2015. The current usage metrics is available 48-96 hours after online publication and is updated daily on week days.
Initial download of the metrics may take a while.