Free Access
Fig. 1
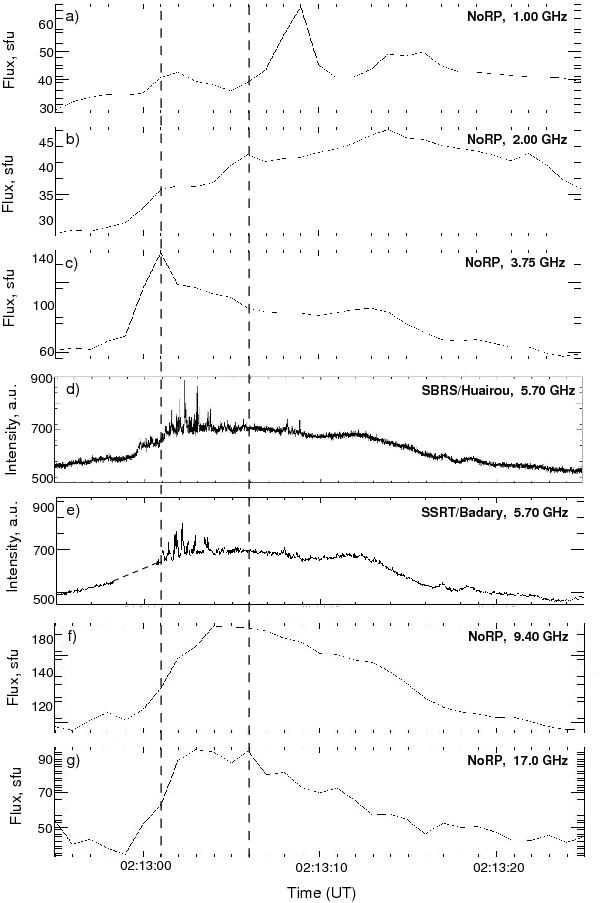
The intensity profiles recorded by Nobeyama spectropolarimeters a)–c), f), g), SBRS d), SSRT e) (including the quiet Sun level) in the interval 02:12:55–02:13:25 UT. The vertical dashed lines mark the interval with the fine structure at 5.7 GHz.)
Current usage metrics show cumulative count of Article Views (full-text article views including HTML views, PDF and ePub downloads, according to the available data) and Abstracts Views on Vision4Press platform.
Data correspond to usage on the plateform after 2015. The current usage metrics is available 48-96 hours after online publication and is updated daily on week days.
Initial download of the metrics may take a while.