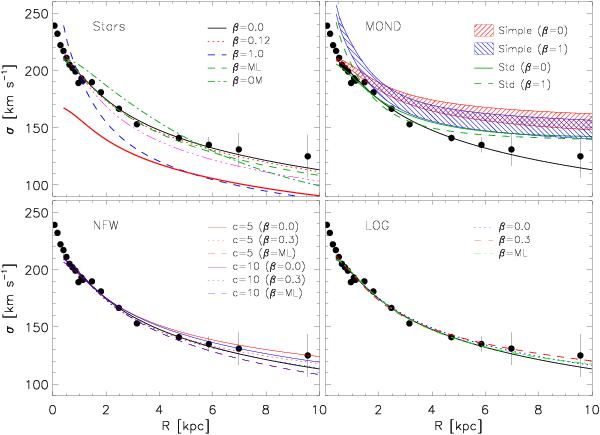
Fig. 8
Dynamical models of NGC 7507. Black circles indicate in all panels the line-of-sight velocity dispersion. All models are given outside of 400 pc, where the luminosity model is unaffected by seeing. Top left: stars-only models. The black solid line is an isotropic model using M/LR = 3.13. This model is shown in all panels as a comparison. The red dotted line is the best-fit model for a constant anisotropy using β = 0.12, while the blue dashed line is a fully radial model (β = 1). The green dashed line is the model using the anisotropy as given in Eq. (16), while the green dot-dashed line is a model using the Osipkov-Merrit anisiotropy (Eq. (17)). The red solid line is a model with M/LR = 2, based on Tortora et al.’s stellar population analysis (see Sect. 5.1). Top right: MOND predictions using the “simple” and “standard” interpolation formulae. The dashed red area is an isotropic model, while the blue area indicates a fully radial model for the former interpolation. Bottom left: NFW models using c = 5 and c = 10. Parameters for each model are reported in Table 6. Bottom right: Logarithmic dark halo models. Using β = 0, β = 0.3, and MŁ anisotropy. Parameters for each model are given in Table 7.
Current usage metrics show cumulative count of Article Views (full-text article views including HTML views, PDF and ePub downloads, according to the available data) and Abstracts Views on Vision4Press platform.
Data correspond to usage on the plateform after 2015. The current usage metrics is available 48-96 hours after online publication and is updated daily on week days.
Initial download of the metrics may take a while.