Fig. 6
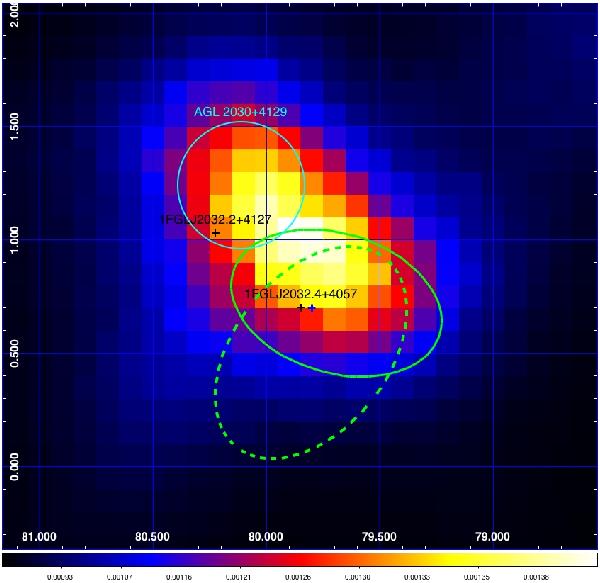
The γ-ray intensity map of the sum of all the Cyg X-3 flares reported in this paper, in Galactic coordinates for E > 100 MeV. Pixel size = 0.1° with 5-pixel Gaussian smoothing. Cyan contours: AGILE-GRID 95% confidence level of LAT PSR J2032+4127; Green continuous contour: the Cyg X-3 flares 95% confidence level (statistical and systematic errors) for E > 100 MeV. Green dashed contour: the Cyg X-3 flares 95% confidence level (statistical and systematic errors) for E > 400 MeV. Black crosses: Fermi-LAT (1-year catalog) sources (crosses shown for contours too small to be visible). The green contour has been calculated with the multi-source likelihood analysis method described in the text, using persistent sources reported in Table 2. Blue cross is the position of Cyg X-3.
Current usage metrics show cumulative count of Article Views (full-text article views including HTML views, PDF and ePub downloads, according to the available data) and Abstracts Views on Vision4Press platform.
Data correspond to usage on the plateform after 2015. The current usage metrics is available 48-96 hours after online publication and is updated daily on week days.
Initial download of the metrics may take a while.