Fig. 2
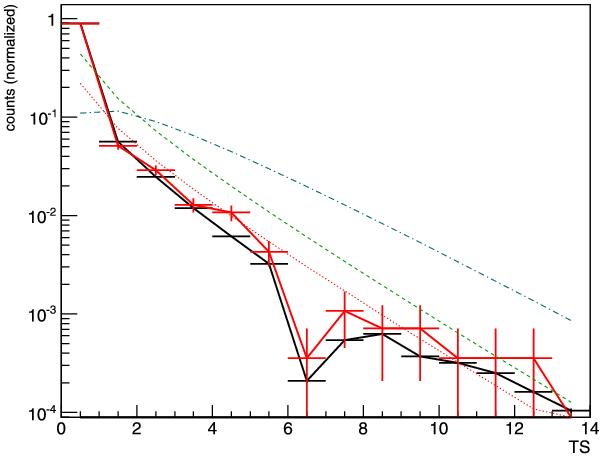
The red histogram is the probability density function (PDF) of Ts values for real AGILE observations of the sources listed in Table 4. The black histogram is the PDF of the Ts values of a simulated Cygnus region with all the sources reported in Table 2 except Cyg X-3 that has zero flux. The notch in the distribution near Ts = 6 is caused by the switch between the fixed and the free position of the source in our analysis method. The red dotted line is the  theoretical distribution, the green dashed line is the
  theoretical distribution, the cyan dotted-dashed line is the
  distribution.
Current usage metrics show cumulative count of Article Views (full-text article views including HTML views, PDF and ePub downloads, according to the available data) and Abstracts Views on Vision4Press platform.
Data correspond to usage on the plateform after 2015. The current usage metrics is available 48-96 hours after online publication and is updated daily on week days.
Initial download of the metrics may take a while.