Fig. 8
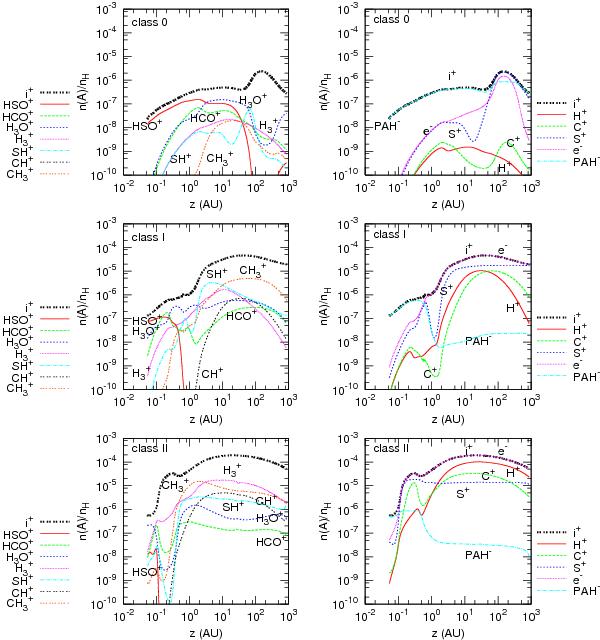
The main ionization contributors along a disk wind streamline launched from 1 AU, for our Class 0, Class I, and Class II models (top to bottom). The left panels plot the fractional abundances relative to H nuclei of molecular ions; the right-hand panels plot abundances of atomic ions and negative species (electrons and PAH−). The total ionisation fraction, X(i+) ≡ n(ions)/nH, is also plotted as a thick black curve.
Current usage metrics show cumulative count of Article Views (full-text article views including HTML views, PDF and ePub downloads, according to the available data) and Abstracts Views on Vision4Press platform.
Data correspond to usage on the plateform after 2015. The current usage metrics is available 48-96 hours after online publication and is updated daily on week days.
Initial download of the metrics may take a while.