Fig. 10
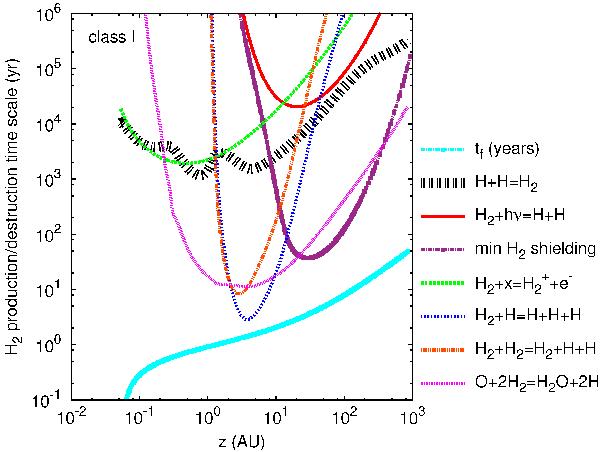
The net timescales (after subtraction of any reverse reaction rate) of the principle reactions that form or destruct H2 are plotted versus altitude along a streamline launched at 1 AU for our Class I model. The flow crossing timescale tf is also plotted at the bottom for comparison. Thin curves denote reactions whose net effect leads to destruction, and thick curves those that lead to net creation. The reactions are H + H = H2: catalytic formation of H2 on grains; H2 + hν = H + H: photodissociation (with the minimum self-shielded rate shown on a separate curve);  : X-ray ionization; O + 2H2 = H2O + 2H: combined oxydation reactions with O and OH; H2 + H and H2 + H2: collisional dissociation; The latter becomes very efficient near z ≃ 2 AU, where the wind temperature reaches 4000 K.
Current usage metrics show cumulative count of Article Views (full-text article views including HTML views, PDF and ePub downloads, according to the available data) and Abstracts Views on Vision4Press platform.
Data correspond to usage on the plateform after 2015. The current usage metrics is available 48-96 hours after online publication and is updated daily on week days.
Initial download of the metrics may take a while.