Fig. 1
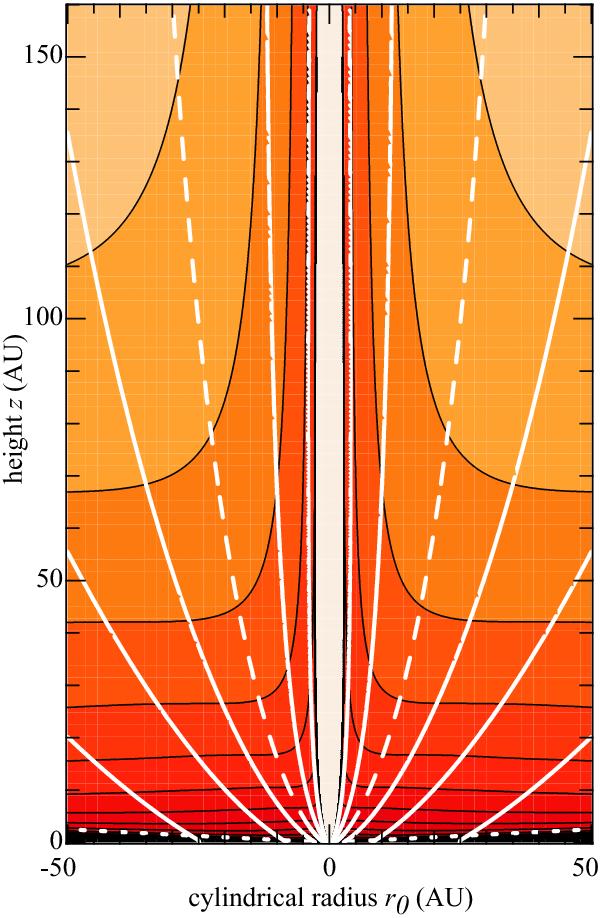
Overall geometry of the “slow” MHD disk wind solution of (Casse & Ferreira 2000) used in this article. Solid white curves show various magnetic flow surfaces, with that anchored at 1 AU shown in dashed. The density for Ṁacc = 10-6 M⊙/yr and M⋆ = 0.5 M⊙, is coded in the contour plot starting at 8 × 104 cm-3 and increasing by factors of 2. The bottom dotted line traces the slow magnetosonic surface (at 1.7 disk scale heights) where our chemical integration starts.
Current usage metrics show cumulative count of Article Views (full-text article views including HTML views, PDF and ePub downloads, according to the available data) and Abstracts Views on Vision4Press platform.
Data correspond to usage on the plateform after 2015. The current usage metrics is available 48-96 hours after online publication and is updated daily on week days.
Initial download of the metrics may take a while.