Fig. 2
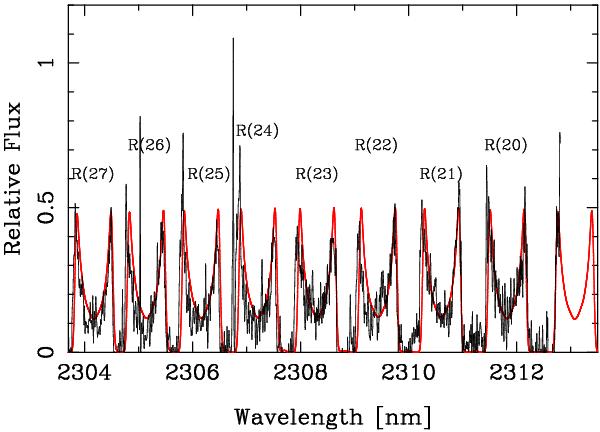
Observed CO R(20)–R(27) in black. The observations are those of Fig. 1 (black). We subtracted unity, and scaled the remainder vertically to fit the observations. R-branch labels are written above the M-shaped profiles. Rest wavelengths of these lines correspond to the inner vertex of the M’s. R(19) is at the extreme right, but only the violet edge of the observed profile is seen. Several sharp spikes may be attributed to imperfect removal of the telluric features that may be seen in the standard star spectrum of Fig. 1. Red shows calculated molecular features for a temperature of 2500 K.
Current usage metrics show cumulative count of Article Views (full-text article views including HTML views, PDF and ePub downloads, according to the available data) and Abstracts Views on Vision4Press platform.
Data correspond to usage on the plateform after 2015. The current usage metrics is available 48-96 hours after online publication and is updated daily on week days.
Initial download of the metrics may take a while.