| Issue |
A&A
Volume 537, January 2012
|
|
|---|---|---|
| Article Number | A93 | |
| Number of page(s) | 4 | |
| Section | Extragalactic astronomy | |
| DOI | https://doi.org/10.1051/0004-6361/201118399 | |
| Published online | 13 January 2012 | |
VLBI imaging of M 81* at 43 GHz
1 Departament d’Astronomia i Astrofísica, Universitat de València, 46100 Burjassot, València, Spain
e-mail: This email address is being protected from spambots. You need JavaScript enabled to view it.
2 Max-Planck-Institut für Radioastronomie, Auf dem Hügel 69, 53121 Bonn, Germany
3 Instituto de Astrofísica de Andalucía, CSIC, Apdo. Correos 3004, 18008 Granada, Spain
e-mail: This email address is being protected from spambots. You need JavaScript enabled to view it.
Received: 24 October 2011
Accepted: 18 November 2011
Abstract
Context. The nearby spiral galaxy M 81 harbours in its core a low-luminosity active galactic nucleus (LLAGN), and appears to be closely related to the more distant and powerful active galactic nuclei (AGNs) seen in quasars and radio galaxies. The intrinsic size of this object is unknown because of too much scattering, and it has shown a core-jet morphology with weak extended emission rotating with wavelength.
Aims. The proximity of M 81 (D = 3.63 Mpc) allows for a detailed investigation of its nucleus. The nucleus is four orders of magnitude more luminous than the Galactic centre, and is therefore considered to be a link between Sgr A⋆ and the more powerful nuclei of radio galaxies and quasars. Our main goal was to determine the size of M 81∗ at a shorter wavelength to directly test whether the frequency-size dependent law Θ ∝ ν-0.8 is still valid for wavelengths shorter than 1 cm. In addition, we also aimed to confirm the rotation of the source as a function of frequency.
Methods. We observed the continuum 7 mm radio emission of M 81∗ with the Very Long Baseline Array on Sep. 13, 2002, using nearby calibrators to apply their interferometric observables to the target source to increase the chances of detection. The source was detected on all baselines and hybrid mapping was possible.
Results. We present the first 7 mm VLBI image of the core of M 81∗, which is the highest resolution image ever of this source. Modelling the interferometric visibilities with two Gaussian functions sets constraints on the angular size of its core down to 38 microarcseconds, corresponding to a maximum (projected) linear size of 138 AU, and shows extended emission towards the NE with a position angle of ~50°. A fit of a one Gaussian elliptical function yields a position angle of 28 ± 8 degrees for its elongated, compact structure. Combining the 7 mm size with earlier measurements at other frequencies, we determine a frequency-size dependence of Θ ∝ ν(−0.88 ± 0.04).
Conclusions. Our VLBI imaging of M 81∗ has clearly detected its core-jet structure, and has allowed us to estimate a size for its core, with a minimum size of 138 AU (≈100 Schwarzschild radii). Our work opens the way for future observations of M 81∗ at high-angular resolution, including the monitoring of its structure, given that much higher bandwidths are currently available on the interferometric networks. In particular, this would allow one to test for possible proper motions of the core or of its components in the inner jet of M 81∗, and for the speed of the detected jet components.
Key words: instrumentation: interferometers / galaxies: active / radio continuum: galaxies / galaxies: individual: M 81 / galaxies: nuclei
© ESO, 2012
1. Introduction
The spiral galaxy M 81 (B0951+633, J095532+69038, NGC 3031, Z 333 − 7, UGC 5318) at a distance of D = 3.63 Mpc, (Freeman et al. 1994) harbours, together with the Seyfert 2 galaxy Centaurus A (D ~ 3.4 Mpc, e.g., Ferrarese et al. 2007; Müller et al. 2011), the closest extragalactic active nucleus. Hubble Space Telescope (HST) spectroscopic observations imply a central mass of 7 × 10⁷ M⊙ (Devereux et al. 2003). The nucleus of M 81 (hereafter referred to as M 81∗) emits in radio with a compact structure and exhibits both low-ionization nuclear emission-line region (LINER; Heckman 1980) and Seyfert 1 characteristics. It thus appears closely related to the more distant and powerful active galactic nuclei (AGNs) seen in quasars and radio galaxies. However, M 81∗ occurs in a spiral rather than in an elliptical galaxy and is relatively small and faint. In fact, very-long-baseline interferometry (VLBI) observations (e.g., Bartel et al. 1982) have shown that the central source is about 1000−4000 AU across, depending on observing frequency, and that the radio luminosity of M 81∗ is ≈1037.5 erg s-1, which classifies M 81∗ as a low-luminosity AGN. Nonetheless, its size is more than two orders of magnitude – and its luminosity about four orders – greater than that of the central source in our Galaxy, Sgr A∗ (e.g., Reuter & Lesch 1996). Therefore, the proximity of M 81∗ allows for a detailed investigation of its nucleus to study the link between our (weak) Galactic centre and the more powerful nuclei of radio galaxies and quasars. Indeed, X-ray and radio observations show that the ratio of the (5 GHz) radio-to-X-ray (soft) luminosity for M 81∗ can vary from RX ~ 1.8 × 10⁻⁵ up to values of RX ~ 3.5 × 10⁻⁴, with the former value being typical of radio-quiet radio galaxies, and the latter of radio-loud LLAGN (see Terashima & Wilson 2003), which suggests that M 81∗ shares properties of both kinds of objects, or may transit from one to another with time.
As seen with VLBI (Bietenholz et al. 2000; Martí-Vidal et al. 2011), the nucleus of M 81∗ shows a stationary feature in its structure – tentatively identified with the core – with a one-sided jet to the northeast. The apparent source size is Θ ~ 0.5 mas (~1800 AU) at 8.4 GHz, and follows a power-law with frequency (Θ ∝ ν-0.8) between 2.3 GHz and 22 GHz. The sky orientation of the radio structure of M 81∗ seems to be frequency dependent as well, changing from ~75° at 2.3 GHz to ~40° at 22 GHz.
Variability of M 81∗ has been reported in several occassions, from X-rays, both long-term (e.g., Ishisaki et al. 1996) and short-term (e.g., Markoff et al. 2008), up to millimeter (Schödel et al. 2007; Markoff et al. 2008) and radio (e.g., Ho et al. 1999; Martí-Vidal et al. 2011) wavelengths. The turnover frequency of the synchrotron spectrum is in the range 150 − 200 GHz (Schödel et al. 2007; Doi et al. 2011). In particular, VLA observations by Ho et al. (1999) at wavelengths of 2 cm to 20 cm in the mid 1990s showed outbursts lasting up to three months. Martí-Vidal et al. (2011) have recently shown that the peaks of flux density are shifted with frequency when variability occurs, which can be interpreted as caused by opacity effects in the inner regions of the jet. M 81∗ is also very peculiar, together with Sgr A∗, in its polarisation properties, because it shows significant circular polarisation (Brunthaler et al. 2001), rather than being linearly polarised, which is much more common among AGNs.
VLBI observations at frequencies above 22 GHz were lacking for M 81∗, limiting our ability to set even tighter constraints on the size of M 81∗. Even from space-VLBI observations at 5 GHz (Bartel & Bietenholz 2001), the source structure remained unresolved. Therefore, we observed this radio source at a frequency of 43 GHz (λ7 mm) using the Very Long Baseline Array (VLBA), with the main goal of constraining the size of the object at 43 GHz. In turn, this would represent a direct test of the apparent frequency-size dependence (Θ ∝ ν-0.8) observed at lower frequencies.
2. Observations and data reduction
We observed M 81∗ on September 13, 2002, using the complete VLBA (Napier 1991) at a frequency of 43 GHz in left-hand circular polarisation. Data were recorded with 2-bit sampling at an aggregate data rate of 256 Mbit s-1, splitting the band into eight intermediate frequency (IF) channels of 8 MHz each (full bandwidth of 64 MHz).
The Seyfert 1 Galaxies 3C 147 and 3C 286 were used as primary calibrators (fringe finding, delay offsets, etc.) of the observation. We used the BL Lac-type object B0954+658 (J0958+6533, z = 0.368, 34 arcmin apart in the sky) as the phase-reference calibrator. From UT 14:43 to UT 20:30 we cycled between the target source M 81∗ (60 s) and B0954+658 (30 s). The source B0951+699 was also used for phase-reference testing purposes during 30 min (UT 14:10 to UT 14:43) as a phase-reference test target.
At the observed data rate, the baseline sensitivity of the VLBA without phase-reference considerations was 66 mJy (1-σ) for an integration time of about 60 s for a sub-band of 8 MHz as used in the observations (23 mJy for the whole band of 64 MHz). This means that a source with a total flux of ~100 mJy and a resolved structure will hardly be detected by long-baseline observations on a sub-band. Assuming that the source would be detected on all VLBA baselines, three hours of integration would provide an image with a 1σ thermal noise of 0.26 mJy beam-1. The overall observing time was 5.75 h. Data were correlated at the Array Operations Center of the National Radio Astronomy Observatory (NRAO) in Socorro, NM, USA.
We followed standard procedures to a first calibration of the amplitudes and phases using  . An a priori amplitude calibration was performed using measured system temperatures and gain curves. After 2-bit-sampling digital correction, amplitude calibration, and the removal of the parallactic angle phase, a single-band delay and phase offsets were calculated automatically with the measured phase-cal values at each antenna. The North-Liberty VLBA station was used as reference antenna during the whole procedure. The Brewster antenna was excluded from the data because of its poor performance.
The main process of the data reduction, the search for group delay and phase rate with the task fring in had to be performed in several steps. Direct fringing on B0951+699, 3C 147, and 3C 286 did not provide a satisfactory percentage of detections. For B0954+658 we obtained in a first attempt detections more than 80% of the time. The data for this source were then exported and imaged in difmap, where a few iterations of phase and amplitude self-calibration were applied. The amplitude was only corrected for an overall factor for each antenna. This factor was applied to all sources back in . The CLEAN components of the data resulting from difmap were also imported back to and were used as input for the task fring to obtain new values for the phase and rate for the calibrator source. Those values were then transferred to the target source M 81∗, and the task imagr was applied to these data to obtain a preliminary phase-referenced image of our target source.
Once we had a solution for the rates and delays for M 81∗, transferred from B0954+658, we narrowed the search windows in fring and performed a new search for the target source with a signal-to-noise satisfactory detection threshold of 3, to obtain a satisfactory number of visibilities with a high detection rate. The resulting data set could then be exported to difmap, and hybrid mapping with phase and (eventually) amplitude self-calibration was performed on M 81∗.
3. Results and discussion
3.1. Phase-referencing
The phase-referenced image obtained after this process had a weak peak with a small offset with respect to the position used in the correlator. The value for the position was obtained by applying the task jmfit to the image obtained with imagr. The jmfit position is therefore  and
and  . The uncertainty provided by jmfit for both values (which does not account for systematics in the astrometric data reduction) is 0.12 milliarcseconds. This should not be compared directly with the phase-referenced positions to SN 1993J reported by other authors because we used another reference. Different attempts to obtain a phase-referenced image after removing different antennas were made, and we noticed that the first two hours of observations and the removal of the antennas in Hancock (system temperature, Tsys, values of above 150 K and relative humidity values, hr, of ~40% were measured; the other antennas had values of ~100 K and dryer atmospheres) and Saint-Croix (Tsys values above 200 K and hr values above 60%) from the data set had the effect of improving the phase-referenced image.
3.2. Hybrid mapping
For the data set with direct detections by fring after using the calibrator’s solutions (that is not the phase-referenced solution and we preferred this approach because of the bad weather during the observations, which produced high tropospheric systematics), we were able to perform hybrid mapping with standard procedures, which involved multiple iterations of CLEAN and phase self-calibration. The resulting angular resolution for the observed (u,v)-distribution time is of approximately 0.36 × 0.17 mas at a PA of ~0°.
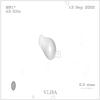 |
Fig. 1 Contour image of M 81∗ obtained by hybrid mapping on the self-calibrated data set. Contours are logarithmic, separated by a factor |

Amplitude self-calibration was only performed once, with a smoothing time segment of 1 h. The amplitude corrections remained within 15% of the original calibration, which also included the gain corrections for the calibrator B0954+658 (see the previous section). Applying shorter time intervals to the amplitude self-calibration did not provide satisfactory results, likely because of the large uncertainties in the visibilities. The resulting hybrid map, produced with natural weighting, is shown in Fig. 1. The root-mean-square noise reached in the image was 560 μJy beam-1. The emission to the SW is not significant and does not affect the model fitting results shown below. The structure of M 81∗ is very compact, with hints of emission towards the NE. This structure information is present in the closure-phases and is a robust result. Indeed, any attempt to remove this emission to the NE while trying to obtain it in any other direction (by setting appropriate clean windows) or self-calibrating the data without jet emission, yielded unsuccessful results, with the residual map always showing the need of emission towards the NE.
3.3. Gaussian model fitting
Using the calibrated data set, we model-fitted the interferometric visibilities with Gaussian functions to parameterise the source emission. We tried to reproduce the observed visibilities by using four different fitting procedures: (i) a single Gaussian circular function (component); (ii) a single elliptical Gaussian; (iii) two circular Gaussians, and (iv) two elliptical Gaussians. The results are shown in Table 1 (flux density, offset in right ascension and declination with respect to the main component, major axis of the Gaussian function, axis ratio, position angle of the major axis, and reduced likelihood parameter). Our results obtained for a single elliptical Gaussian are comparable with earlier publications (see Bartel et al. 1995).
The fit of two circular Gaussians allowed us to quantify both the core and jet emission. The main central component accounts for 80% of the whole emission, while the remaining ~20% are in the jet component, which has a position angle of ~50°.
Gaussian model fit results.
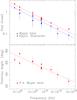 |
Fig. 2 Size (top) and position angle (bottom) of M 81∗ as a function of frequency. We plot the data from Table 2. The two lines in the top panel are power-law fits to the shown data. The slopes are −0.88 ± 0.04, and −0.89 ± 0.08, respectively, for the major axis and the equivalent diameters of the source. The line in the bottom panel, drawn as a guide, is the function φ = (350 ± 36)° − (30 ± 4)° × (log (ν/Hz)). We did not use the data from Ref. 6 in Table 2 because this is the core component only, and an extended jet component, 1 mas away, was also fitted (in this way, which is therefore not comparable with the other values, which fit core and jet together). |
Table 2 shows earlier published data for M 81∗ at different observing frequencies together with our own data (last row). The table contains the relevant parameters that characterise the source structure: major axis, axis ratio, position angle, and equivalent diameter. The equivalent diameter is a measure of the area covered by the Gaussian function. Our size determination for M 81∗ is given in the last row of the table, and corresponds to the best fit to a single elliptical Gaussian component (see Table 1). The uncertainties shown for the size determination at 43 GHz were calculated from the response of χ2 to small variations (in small steps of 1% for the major axis and axis ratio up to ± 10% and of 1° in a range ± 10° for the position angle of the major axis).
Figure 2 (top) shows the size of M 81∗ as a function of frequency, using two different parameters: (i) the size of the major axis of the source (red triangles); and (ii) the equivalent diameter of the source (blue circles). A power-law fit to the major axis results in a dependence of size ∝ ν − 0.88 ± 0.04. The same fit to the equivalent diameter yields essentially the same dependence, size ∝ ν − 0.89 ± 0.08. The model predictions at 43 GHz for the two parameters are ~ 0.12 mas and ~ 0.082 mas, respectively, which are smaller than the measured quantities of 0.160 ± 0.025 mas, and 0.087 ± 0.037 mas, respectively (even with the very large uncertainties). If we compare the value for the size of the nucleus as taken from the one-component elliptical Gaussian fit (162 μas in the longest dimension, with an equivalent diameter of 86 μas) with the one obtained from the model fit including two circular Gaussian components, from the brightest one (38 μas), we see a margin for uncertainty in the fit. In any case, the comparison with the longer wavelengths is valid and we have found limits to the size of the emitting region in M 81∗ at λ 7 mm.
Therefore, the value found for the angular size of M 81∗ is in the range (162 − 45) μas (major and minor axis, respectively) down to a lower limit of 38 μas. Those values correspond to linear sizes of (590 − 163) AU to 138 AU, respectively. Notice that for the central mass of 7 × 10⁷ M⊙, the Schwarzschild radius corresponds to 1.4 AU. This is the most tight constraint on the size of M 81∗ ever. We also note that the size of the major axis follows a power-law with frequency very well, although our measurement may suggest a flattening of this trend, following the same method as earlier authors. The core brightness temperatures determined from the model fit sizes in Table 2 are in the range 10(10.1 − 10.8), which is of the same order of magnitude as the values for LLAGNs reported in Anderson & Ulvestad (2005), and is therefore below the inverse Compton limit.
If we plot the position angle of the major angle of the ellipse as a function of the logarithm of frequency (Fig. 2, top), a clear linear trend is evident, with our data point confirming previous results reported by Bartel et al. (1995), among other authors. A logarithmic fit to the data points yields a negative trend of PA = (350 ± 36)° − (30 ± 4)°log (ν/Hz), implying that the source orientation rotates northwards with increasing frequency. Following this trend, the PA of the core at the turnover frequency of ≈ 200 GHz would be ~10°, this value is the most probable. Several scenarios can explain this apparent rotation: a strong jet bending as suggested by Martí-Vidal et al. (2011) model fitting; a wide angle opening in the base of the jet, visible at high frequencies; or even if the “core” corresponds to radio emission of the accretion disk region. Future observations at high frequencies with astrometric registration of the core region should give the answer.
4. Summary
We have presented the highest resolution image ever of the nucleus of M 81∗, and have set up a stringent constraint on the (projected) size of its core of 138 AU, or ~100 Schwarzschild radii. By making use of existing size VLBI measurements for M 81∗ from 1.7 up to 22.2 GHz, and adding up our measurement at 43 GHz, we find that the size of the core and jet region of M 81∗ is best-fit by a frequency-size dependent power-law ∝ ν − 0.84 ± 0.04, in agreement with previous results. Our 43 GHz data point may suggest a flattening of the power-law at frequencies around, or above, 43 GHz, though.
Our work opens a way for future multi-epoch high-resolution VLBI observations at 43 GHz, as well as at higher frequencies, which will help elucidate some of the most important questions yet unsolved for M 81∗. In particular, such observations would be very useful in constraining parameters of the radio emission models for M 81∗, and they would also provide valuable information regarding the structure variability of the core-jet, e.g., the lifetime of the perturbations travelling down the jet.
Acknowledgments
We acknowledge J. Anderson for careful reading and very useful comments to the manuscript. The Very Long Baseline Array is operated by the National Radio Astronomy Observatory, a facility of the National Science Foundation operated under cooperative agreement by Associated Universities, Inc. This research has made use of NASA’s Astrophysics Data System. E.R. acknowledges partial support by the Spanish MICINN through grant AYA2009-13036-C02-02, and by the COST action MP0905 “Black Holes in a Violent Universe”. M.A.P.T. acknowledges partial support by the Spanish MICINN through grant AYA2009-13036-C02-01, co-funded with FEDER funds, and by the Consejería de Innovación, Ciencia y Empresa of the Junta de Andalucía through grants FQM-1747 and TIC-126.
References
- Anderson, J., & Ulvestad, J. U. 2005, ApJ, 627, 674 [NASA ADS] [CrossRef] [Google Scholar]
- Bartel, N., & Bietenholz, M. F. 2000, in Astrophysical Phenomena revealed by Space VLBI, ed. H. Hirabayashi, P. G. Edwards, & D. W. Murphy, Sagamihara, Japan, Institute of Space and Astronautical Science, 17 [Google Scholar]
- Bartel, N., Shapiro, I. I., Corey, B. E., et al. 1982, ApJ, 262, 556 [NASA ADS] [CrossRef] [Google Scholar]
- Bartel, N., Bietenhoz, M. F., & Rupen, M. P. 1995, Proc. Natnl. Acad. Sci., 92, 11374 [NASA ADS] [CrossRef] [Google Scholar]
- Bietenholz, M. F., Bartel, N., Rupen, M. P., et al. 1996, ApJ, 457, 604 [NASA ADS] [CrossRef] [Google Scholar]
- Bietenholz, M. F., Bartel, N., & Rupen, M. P. 2000, ApJ, 532, 895 [NASA ADS] [CrossRef] [Google Scholar]
- Brunthaler, A., Bower, G. C., Falcke, H., & Mellon, R. R. 2001, ApJ, 560, L123 [NASA ADS] [CrossRef] [Google Scholar]
- Devereux, N., Ford, H., Tsvetanov, Z., & Jacoby, G. 2003, AJ, 125, 1226 [NASA ADS] [CrossRef] [Google Scholar]
- Doi, A., Nakanishi, K., Nagai, H., Kohno, K., & Kameno, S. 2011, AJ, 142, 167 [NASA ADS] [CrossRef] [Google Scholar]
- Ferrarese, L., Mould, J. R., Stetson, P. B., et al. 2007, ApJ, 654, 186 [NASA ADS] [CrossRef] [Google Scholar]
- Freedman, W. L., Hughes, S. M., Madore, B. F., et al. 1994, ApJ, 427, 628 [NASA ADS] [CrossRef] [Google Scholar]
- Heckman, T. M. 1980, A&A, 87, 152 [NASA ADS] [Google Scholar]
- Ho, L. C., van Dyk, S. D., Pooley, G. G., Sramek, R. A., & Weiler, K. W. 1999, AJ, 118, 843 [NASA ADS] [CrossRef] [Google Scholar]
- Ishisaki, Y., Makishima, K., Iyomoto, N., et al. 1996, PASJ, 48, 237 [NASA ADS] [Google Scholar]
- Kellermann, K. I., Shaffer, D. B., Pauliny-Toth, I. I. K., Preuss, E., & Witzel, A. 1976, ApJ, 210, L121 [NASA ADS] [CrossRef] [Google Scholar]
- Markoff, S., Nowak, M., Young, A., et al. 2008, ApJ, 681, 905 [NASA ADS] [CrossRef] [Google Scholar]
- Martí-Vidal, I., Marcaide, J. M., Alberdi, A., et al. 2011, A&A, 533, A111 [NASA ADS] [CrossRef] [EDP Sciences] [Google Scholar]
- Müller, C., Kadler, M., Ojha, R., et al. 2011, A&A, 530, L11 [NASA ADS] [CrossRef] [EDP Sciences] [Google Scholar]
- Napier, P. J. 2001, in Radio Interferometry: Theory, Techniques and Applications, ed. T. J. Cornwell, & R. A. Perley (San Francisco: ASP), IAU Coll., 131, ASP Conf. Ser., 19, 390 [Google Scholar]
- Reuter, H.-P., & Lesch, H. 1996, A&A, 310, L5 [NASA ADS] [Google Scholar]
- Schödel, R., Krips, M., Markoff, S., Neri, R., & Eckart, A. 2007, A&A, 463, 551 [NASA ADS] [CrossRef] [EDP Sciences] [Google Scholar]
All Tables
All Figures
|
Fig. 1 Contour image of M 81∗ obtained by hybrid mapping on the self-calibrated data set. Contours are logarithmic, separated by a factor |
| In the text | |
|
Fig. 2 Size (top) and position angle (bottom) of M 81∗ as a function of frequency. We plot the data from Table 2. The two lines in the top panel are power-law fits to the shown data. The slopes are −0.88 ± 0.04, and −0.89 ± 0.08, respectively, for the major axis and the equivalent diameters of the source. The line in the bottom panel, drawn as a guide, is the function φ = (350 ± 36)° − (30 ± 4)° × (log (ν/Hz)). We did not use the data from Ref. 6 in Table 2 because this is the core component only, and an extended jet component, 1 mas away, was also fitted (in this way, which is therefore not comparable with the other values, which fit core and jet together). |
| In the text | |
Current usage metrics show cumulative count of Article Views (full-text article views including HTML views, PDF and ePub downloads, according to the available data) and Abstracts Views on Vision4Press platform.
Data correspond to usage on the plateform after 2015. The current usage metrics is available 48-96 hours after online publication and is updated daily on week days.
Initial download of the metrics may take a while.