Fig. 2
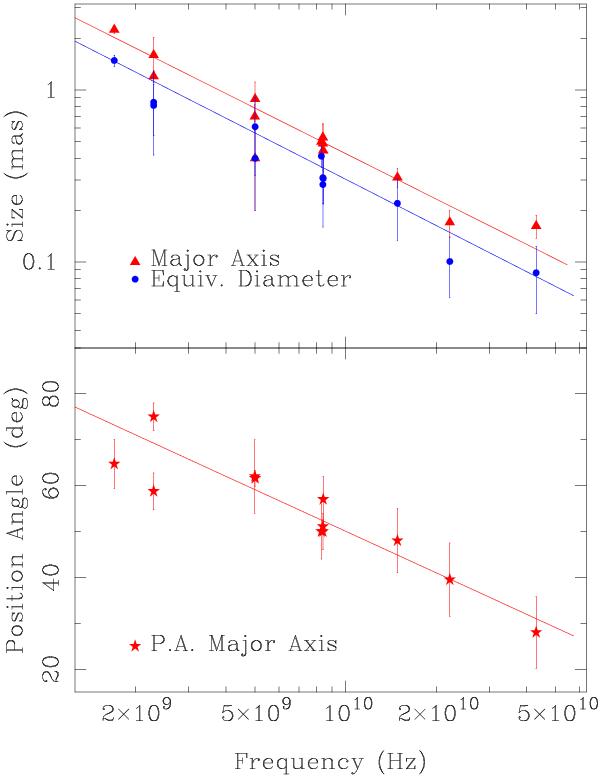
Size (top) and position angle (bottom) of M 81∗ as a function of frequency. We plot the data from Table 2. The two lines in the top panel are power-law fits to the shown data. The slopes are −0.88 ± 0.04, and −0.89 ± 0.08, respectively, for the major axis and the equivalent diameters of the source. The line in the bottom panel, drawn as a guide, is the function φ = (350 ± 36)° − (30 ± 4)° × (log (ν/Hz)). We did not use the data from Ref. 6 in Table 2 because this is the core component only, and an extended jet component, 1 mas away, was also fitted (in this way, which is therefore not comparable with the other values, which fit core and jet together).
Current usage metrics show cumulative count of Article Views (full-text article views including HTML views, PDF and ePub downloads, according to the available data) and Abstracts Views on Vision4Press platform.
Data correspond to usage on the plateform after 2015. The current usage metrics is available 48-96 hours after online publication and is updated daily on week days.
Initial download of the metrics may take a while.