Fig. 12
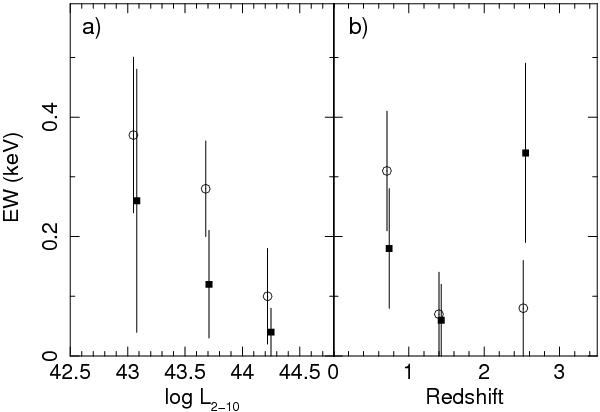
Plot of EW of the Fe K line at 6.4 keV (open circles) and 6.9 keV (filled squares) measured from a) the three 2–10 keV luminosity bins or b) the three redshift bins (see Table 3). The EW is plotted against the median value of luminosity/z in each bin. Note that the high-z point for the 6.9 keV line is a sum of Fe xxv (6.70 keV) and Fe xxvi (6.97 keV).
Current usage metrics show cumulative count of Article Views (full-text article views including HTML views, PDF and ePub downloads, according to the available data) and Abstracts Views on Vision4Press platform.
Data correspond to usage on the plateform after 2015. The current usage metrics is available 48-96 hours after online publication and is updated daily on week days.
Initial download of the metrics may take a while.