Fig. 7
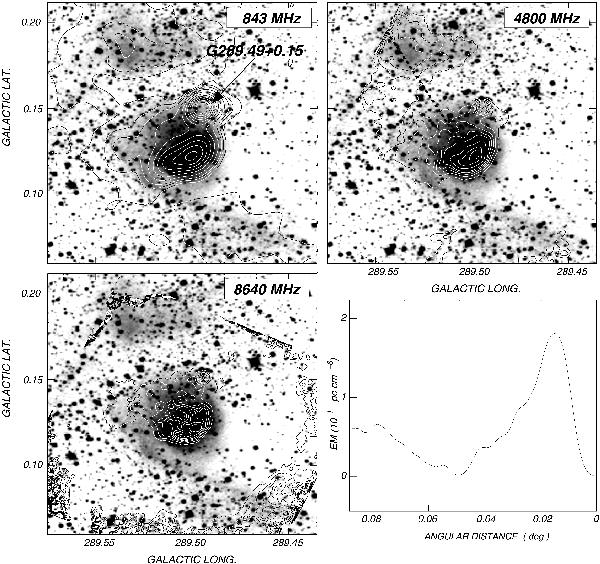
Upper left panel: radio continuum image at 843 MHz (contours) superimposed on the DSSR image (grayscale). Contours levels go from 4 mJy beam-1 (~3 rms)to 12 mJy beam-1 in steps of 4 mJy beam-1, and from 20 mJy beam-1 in steps of 10 mJy beam-1. Upper right panel: radio continuum image at 4800 MHz (contours) superimposed to the DSSR image (grayscale). Contours levels go from 2.4 mJy beam-1 (~3 rms)to 10.4 mJy beam-1 in steps of 2 mJy beam-1, and from 10.4 mJy beam-1 in steps of 4 mJy beam-1. The symmetry axis of the nebula is depicted by the dotted line. Lower left panel: radio continuum image at 8640 MHz (contours) superimposed to the DSSR image (grayscale). Contours levels go from 15 mJy beam-1 (~3 rms)in steps of 1 mJy beam-1. Lower right panel: emission measure profile obtained from the 4800 MHz radio continuum image along the symmetry axis of NGC 3503 .
Current usage metrics show cumulative count of Article Views (full-text article views including HTML views, PDF and ePub downloads, according to the available data) and Abstracts Views on Vision4Press platform.
Data correspond to usage on the plateform after 2015. The current usage metrics is available 48-96 hours after online publication and is updated daily on week days.
Initial download of the metrics may take a while.