Fig. 6
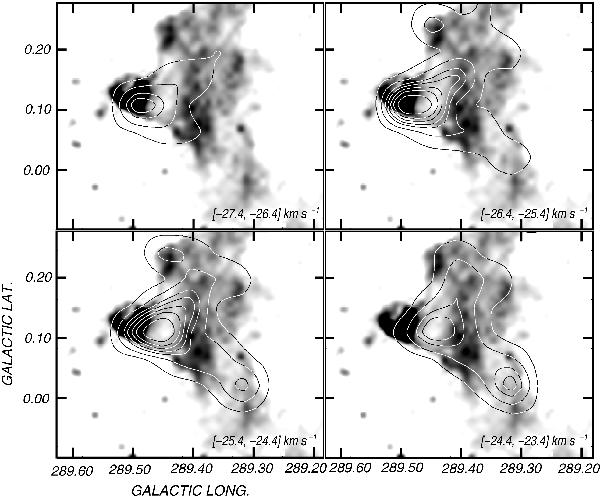
Overlay of mean  -values (contours) in the velocity range from − 27.4 to − 23.4 km s-1 and the MSX band A emission (grayscale). Every image represents the CO emission distribution averaged in a velocity interval of 1 km s-1. The velocity interval is indicated in the bottom right corner of each image. The lowest temperature contour is 0.84 K (~12 rms). The contour spacing temperature is 1.4 K.
Current usage metrics show cumulative count of Article Views (full-text article views including HTML views, PDF and ePub downloads, according to the available data) and Abstracts Views on Vision4Press platform.
Data correspond to usage on the plateform after 2015. The current usage metrics is available 48-96 hours after online publication and is updated daily on week days.
Initial download of the metrics may take a while.