Fig. 4
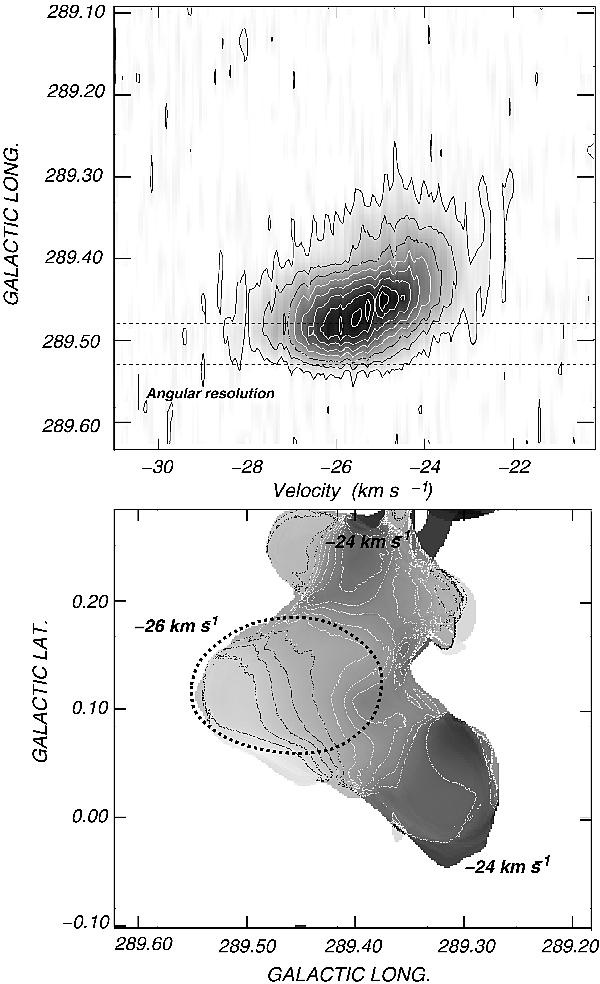
Upper panel: velocity-galactic longitude map obtained in a strip along b = +0 11 (corresponding to clump A) showing
  . Contour levels start at 0.7 K and the contour spacing is 0.7 K. The dotted lines indicate the location of NGC 3503 . Lower panel: mean velocity map of Component 1. Contours levels go from − 26 to − 24 km s-1 , with interval of 0.2 km s-1 . The dotted ellipse depicts approximately the region of clump A.
Current usage metrics show cumulative count of Article Views (full-text article views including HTML views, PDF and ePub downloads, according to the available data) and Abstracts Views on Vision4Press platform.
Data correspond to usage on the plateform after 2015. The current usage metrics is available 48-96 hours after online publication and is updated daily on week days.
Initial download of the metrics may take a while.