Free Access
Fig. 7
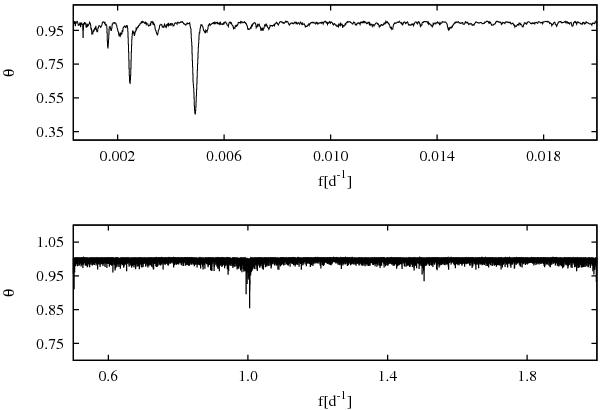
Stellingwerf’s θ statistics for the manually measured RVs of the Hα emission wings plotted vs. frequency f. Upper panel: periods from 3000 0 down to 500. Bottom panel: periods from 20 down to 05. The panels have a different scale on the ordinate.
Current usage metrics show cumulative count of Article Views (full-text article views including HTML views, PDF and ePub downloads, according to the available data) and Abstracts Views on Vision4Press platform.
Data correspond to usage on the plateform after 2015. The current usage metrics is available 48-96 hours after online publication and is updated daily on week days.
Initial download of the metrics may take a while.