Fig. 6
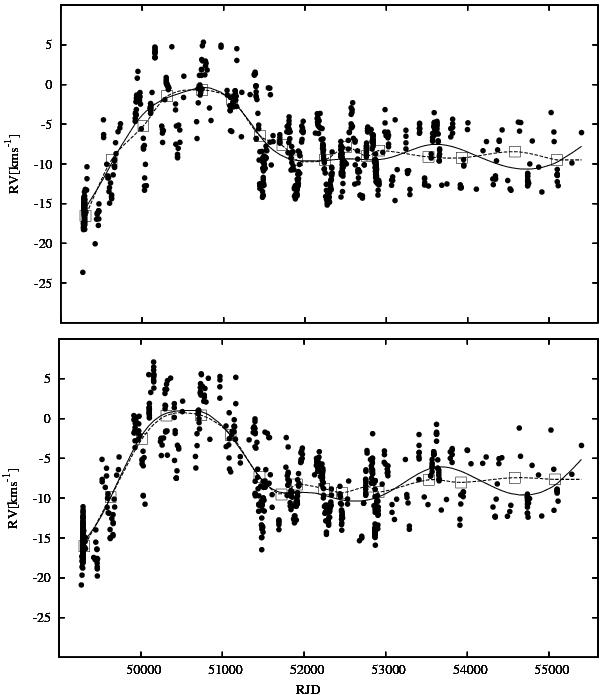
Plots of RVs vs. RJD = HJD-2 400 000: Top panel: manually measured Hα emission-wing RVs. Bottom panel: automatically measured Hα emission-wing RVs. The solid lines in all panels represent the long-term RV change as derived with the program HEC13. The squares in both panels denote the local “systemic” velocities calculated with the program SPEL for individual data subsets. The dashed line represents Hermite-polynomial fit computed with program HEC36. See the text for details.
Current usage metrics show cumulative count of Article Views (full-text article views including HTML views, PDF and ePub downloads, according to the available data) and Abstracts Views on Vision4Press platform.
Data correspond to usage on the plateform after 2015. The current usage metrics is available 48-96 hours after online publication and is updated daily on week days.
Initial download of the metrics may take a while.