Free Access
Fig. 2
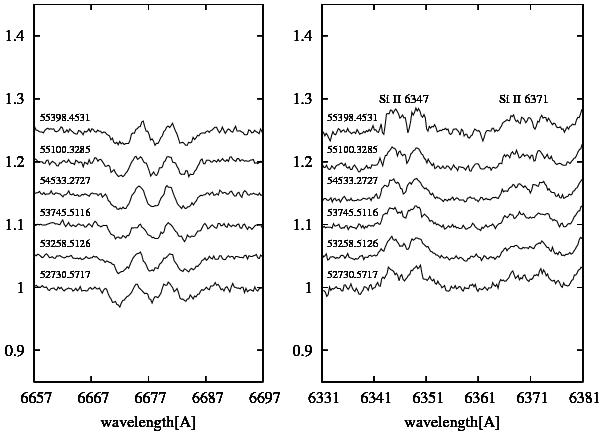
Recent evolution of the He i 6678 Å (left), Si II 6347 Å, and Si II 6371 Å (right) line profiles. Mid-exposure times of the displayed spectra are in RJD = HJD–2 400 000. The vertical axis is in the units of the continuum flux.
Current usage metrics show cumulative count of Article Views (full-text article views including HTML views, PDF and ePub downloads, according to the available data) and Abstracts Views on Vision4Press platform.
Data correspond to usage on the plateform after 2015. The current usage metrics is available 48-96 hours after online publication and is updated daily on week days.
Initial download of the metrics may take a while.