Fig. 3
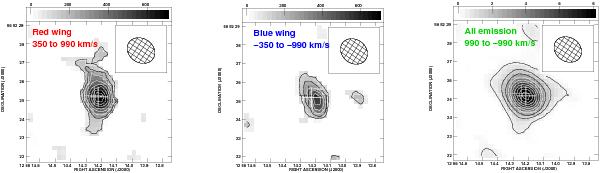
Integrated intensities of the HCN 1–0 line emission. Left panel: the red-shifted wing emission from 350 to 990 km s-1. The grayscale range is from 0 to 0.7 Jy km s-1 (beam )-1 and the contours start at 0.098 Jy km s-1 (beam)-1 with steps of 0.0998 Jy km s-1 (beam)-1. Middle panel: the blue-shifted wing emission from −990 to −350 km s-1. Same grayscale and contours as for the previous panel. Right panel: the total (from − 990 km s-1 to 990 km s-1) integrated HCN 1–0 line emission from Mrk 231. The grayscale range is from 0 to 8 Jy km s-1 (beam)-1 and the contour levels are 0.45 Jy km s-1 (beam)-1 × (1,3,5,7,9,11,13,15,17,19). The thick white crosses mark the peak of the integrated HCN 1–0 line emission and the thinner crosses indicate the VLBI position (see footnote to Table 1) and 1′′ = 870 pc. Hatched ellipse indicates beam size and orientation.
Current usage metrics show cumulative count of Article Views (full-text article views including HTML views, PDF and ePub downloads, according to the available data) and Abstracts Views on Vision4Press platform.
Data correspond to usage on the plateform after 2015. The current usage metrics is available 48-96 hours after online publication and is updated daily on week days.
Initial download of the metrics may take a while.