Fig. 4
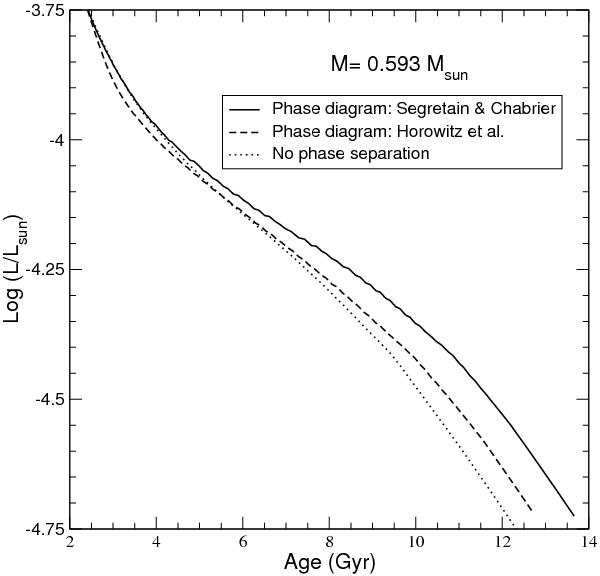
Surface luminosity versus age for the 0.593 M⊙ white dwarf sequences undergoing carbon-oxygen phase separation. Solid and dashed curves correpond to the predictions of the phase diagrams of Segretain & Chabrier (1993) and Horowitz et al. (2010), respectively. The cooling curve in the case that carbon-oxygen phase separation is not considered is also shown as a dotted line.
Current usage metrics show cumulative count of Article Views (full-text article views including HTML views, PDF and ePub downloads, according to the available data) and Abstracts Views on Vision4Press platform.
Data correspond to usage on the plateform after 2015. The current usage metrics is available 48-96 hours after online publication and is updated daily on week days.
Initial download of the metrics may take a while.