Fig. 2
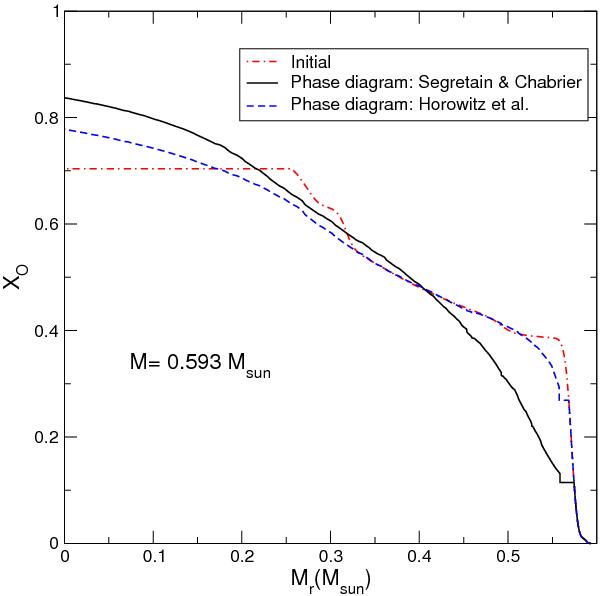
Inner oxygen distribution (abundance by mass) for the 0.593 M⊙ white dwarf model at different evolutionary stages. The (red) dot-dashed line corresponds to the oxygen distribution before the occurrence of crystallization. The final oxygen profile when most of the white dwarf has crystallized is also shown for the phase diagram of Horowitz et al. (2010) – (blue) dashed line – and for the phase diagram of Segretain & Chabier (1993) – (black) solid line.
Current usage metrics show cumulative count of Article Views (full-text article views including HTML views, PDF and ePub downloads, according to the available data) and Abstracts Views on Vision4Press platform.
Data correspond to usage on the plateform after 2015. The current usage metrics is available 48-96 hours after online publication and is updated daily on week days.
Initial download of the metrics may take a while.