Free Access
Fig. 4
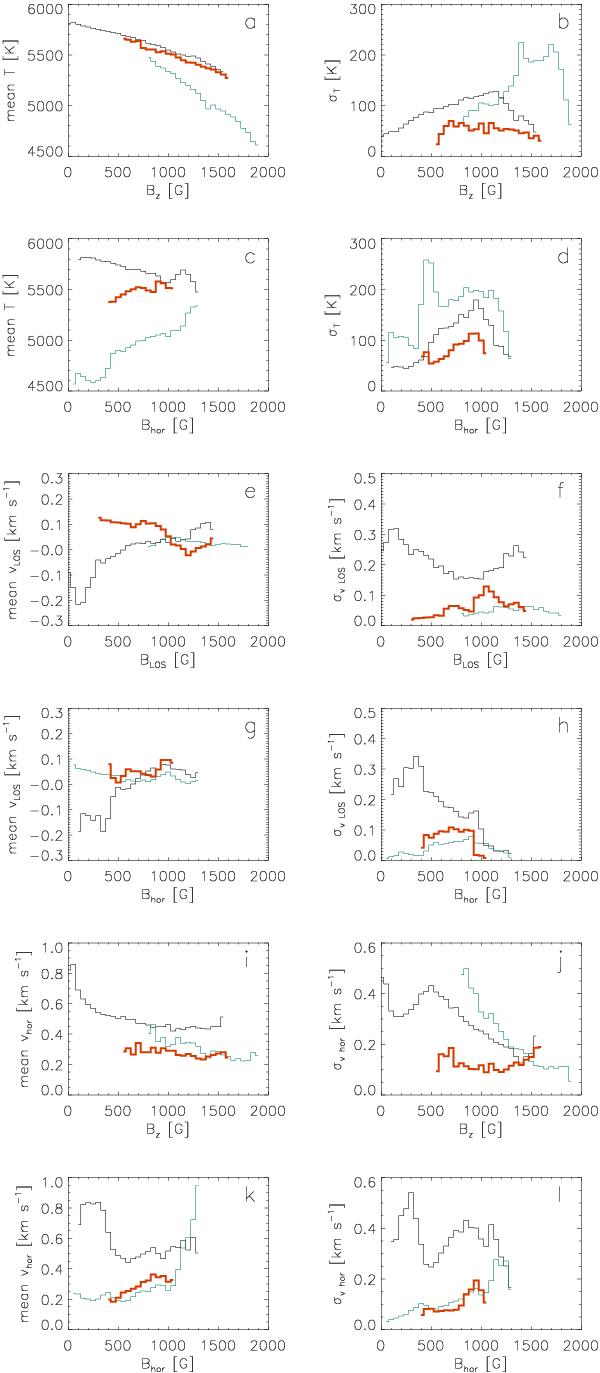
Graphs of relations between temperature T, LOS velocity vLOS, horizontal velocity vhor and magnetic field components BLOS, Bz, and Bhor. Left – mean values, right – σ values. Black line – photospheric granulation, red (thick) – light bridge, green (grey) – umbra.
Current usage metrics show cumulative count of Article Views (full-text article views including HTML views, PDF and ePub downloads, according to the available data) and Abstracts Views on Vision4Press platform.
Data correspond to usage on the plateform after 2015. The current usage metrics is available 48-96 hours after online publication and is updated daily on week days.
Initial download of the metrics may take a while.