Fig. 4
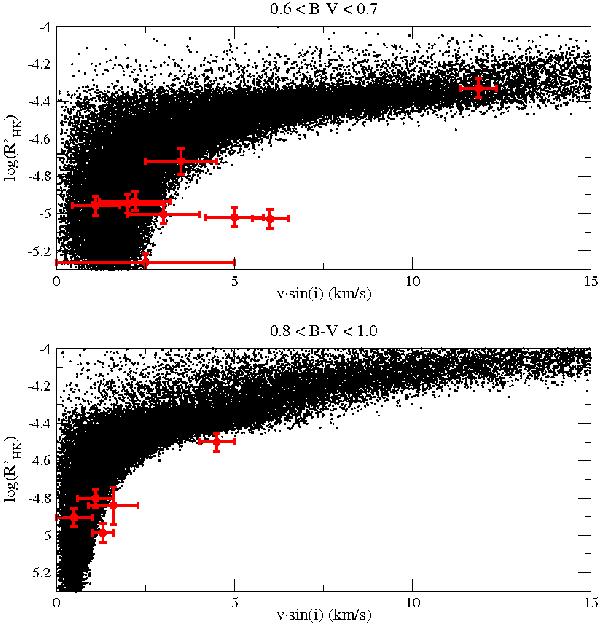
Two subsets of transiting planet host stars (red symbols): solar type (top diagram) and early K-type (bottom diagram). Individual color indices and errors are used to constrain the (B − V) range of the simulated sample for each star and error bars were used to define the box to calculate the statistics (see text). Note that real data points are shown for simulated samples of a wider spectral range for convenience.
Current usage metrics show cumulative count of Article Views (full-text article views including HTML views, PDF and ePub downloads, according to the available data) and Abstracts Views on Vision4Press platform.
Data correspond to usage on the plateform after 2015. The current usage metrics is available 48-96 hours after online publication and is updated daily on week days.
Initial download of the metrics may take a while.