Fig. 3
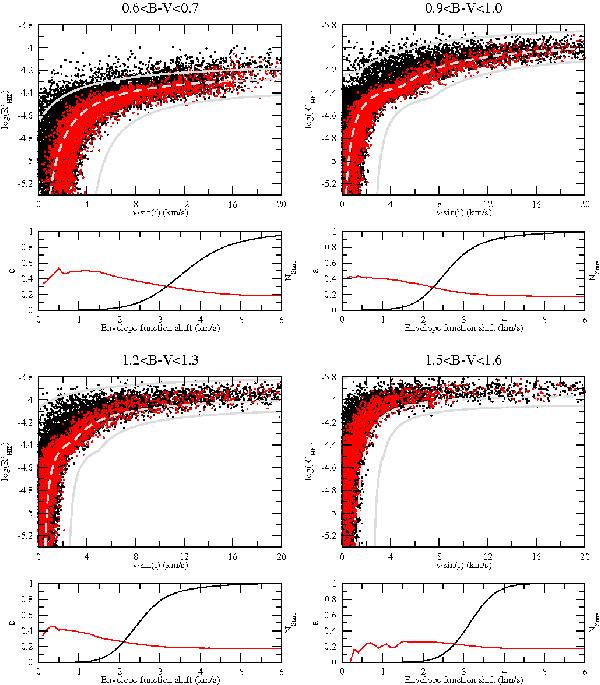
Four simulated samples limited in color index as indicated. Stars with i > 80° are plotted in red. The gray envelope function, calculated as described in Sect. 3.3, is shifted from the right hand side of the distribution to the left considering a slope so that it scans the high-inclination region (see text). At each step the efficiency (Eq. (4), with α = 80°) is calculated for the subsample below the envelope function. The red line in the bottom diagrams shows the evolution of ϵ as the region limited by the function is expanded to the left, and the black line indicates the total fraction of stars in the region (NStars ~ 1). As expected, ϵ tends to ~0.17 for NStars ~ 1. The dotted gray line in the upper diagrams indicates the region where ϵ = 0.26, therefore the efficiency is increased by 50% with respect to a non-preselected sample.
Current usage metrics show cumulative count of Article Views (full-text article views including HTML views, PDF and ePub downloads, according to the available data) and Abstracts Views on Vision4Press platform.
Data correspond to usage on the plateform after 2015. The current usage metrics is available 48-96 hours after online publication and is updated daily on week days.
Initial download of the metrics may take a while.