Fig. 2
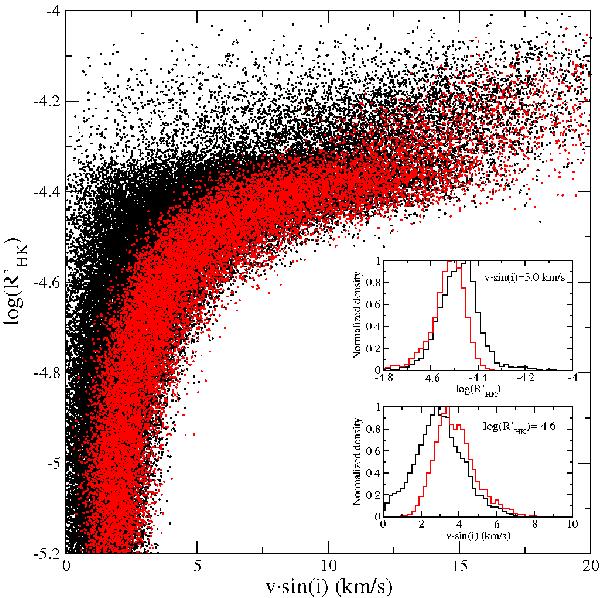
Sample of 100 000 solar-type stars (0.6 < (B − V) < 0.7) simulated with the procedure described in Sect. 3.1. Random errors with a Gaussian distribution (σ = 0.5 km s-1) were added to the vsini values. Stars with projected axis inclinations above 80° are represented in red and trace the envelope region at the right hand of the distribution. For a constant  , stars are expected to have a very similar equatorial velocity in terms of the rotation and activity evolution assumptions, and so different vsini are mainly caused by different axis projections. The histograms in the two overlayed plots show the density distribution of the simulated samples at two cuts made at constant
  and vsini = 7.5 km s-1, respectively.
Current usage metrics show cumulative count of Article Views (full-text article views including HTML views, PDF and ePub downloads, according to the available data) and Abstracts Views on Vision4Press platform.
Data correspond to usage on the plateform after 2015. The current usage metrics is available 48-96 hours after online publication and is updated daily on week days.
Initial download of the metrics may take a while.