Fig. 1
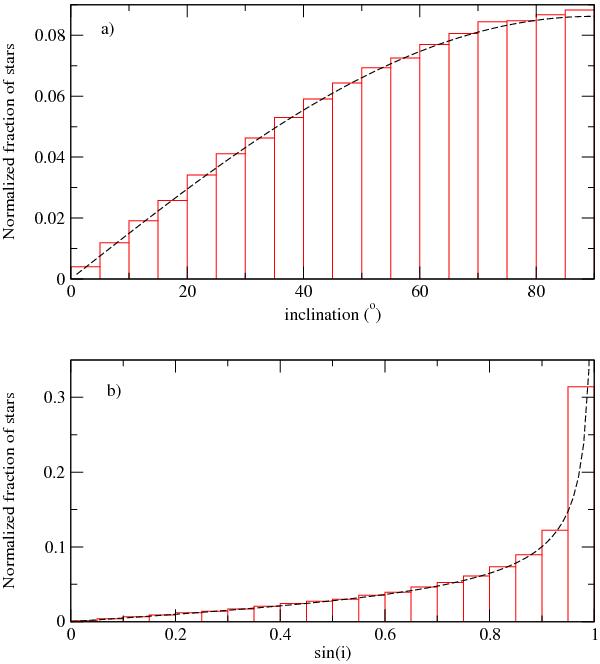
a) Frequency of stars in the simulated sample depending on the inclination of their rotation axis toward our line of sight, considering an isotropic distribution resulting from the simulation. b) Frequency of sini values in the same distribution. The behavior of the sine function, weighed toward sini = 1, impedes a selection of highly inclined stars. The analytic functions that describe the distributions are also plotted in both graphs (dashed lines).
Current usage metrics show cumulative count of Article Views (full-text article views including HTML views, PDF and ePub downloads, according to the available data) and Abstracts Views on Vision4Press platform.
Data correspond to usage on the plateform after 2015. The current usage metrics is available 48-96 hours after online publication and is updated daily on week days.
Initial download of the metrics may take a while.