Fig. 6
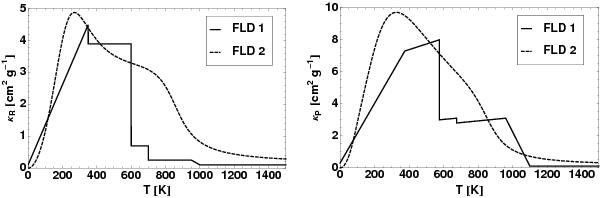
Rosseland mean opacities κR (left panel) and Planck mean opacities κP (right panel) per gram gas as a function of the local radiation temperature T. The label “FLD 1” denotes the opacity description by Krumholz et al. (2007), Eq. (11) therein. The label “FLD 2” denotes the opacities used in Kuiper et al. (2010a, 2011) as well as in this paper; these opacities are computed based on the density-dependent evaporation of dust grains using the low density of the polar cavities.
Current usage metrics show cumulative count of Article Views (full-text article views including HTML views, PDF and ePub downloads, according to the available data) and Abstracts Views on Vision4Press platform.
Data correspond to usage on the plateform after 2015. The current usage metrics is available 48-96 hours after online publication and is updated daily on week days.
Initial download of the metrics may take a while.