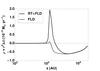
Fig. 5
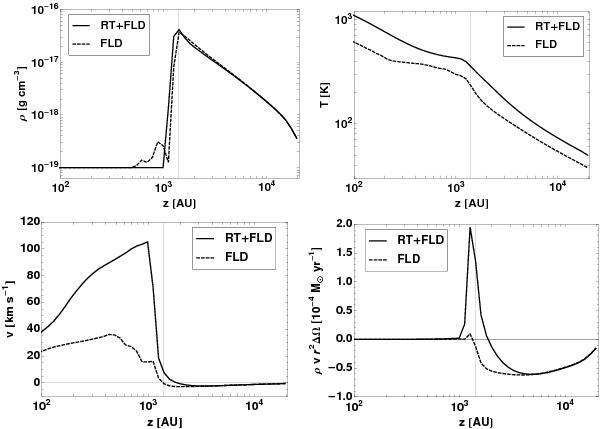
Gas density ρ (upper left panel), temperature T (upper right panel), radial velocity v (lower left panel), and radial mass-loss rate (lower right panel) as a function of height z above the star along the polar axis. Data is for the run with initial core mass Mcore = 100 M⊙ and radial density slope β = −2. The snapshot in time (t = 16.7 kyr) is chosen in such a way that the cavity shell has arrived at the same location in both simulations (RT+FLD and FLD only). The lowest density of in the upper left panel is given by the numerical floor value of the hydrodynamics solver.
Current usage metrics show cumulative count of Article Views (full-text article views including HTML views, PDF and ePub downloads, according to the available data) and Abstracts Views on Vision4Press platform.
Data correspond to usage on the plateform after 2015. The current usage metrics is available 48-96 hours after online publication and is updated daily on week days.
Initial download of the metrics may take a while.