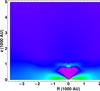
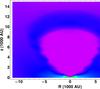
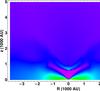
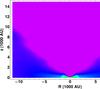
Fig. 3
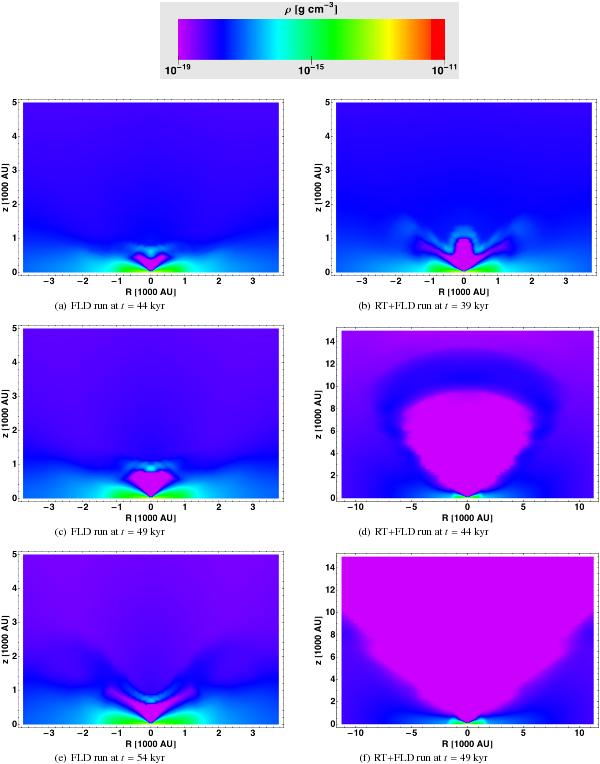
Simulation snapshots of the gas density for one of the FLD (left panels) and one of the ray-tracing + FLD (right panels) runs for three different points in time during the launch of the radiation pressure dominated cavities. The data is taken from the runs with initial core mass Mcore = 50 M⊙ and a radial density slope of β = −2. The spatial section of the RT+FLD snapshots increases with time to follow the rapid expansion of the outflow cavity. Animations of the launch of the radiation-pressure-dominated cavities in the simulations are available as online material, too.
Current usage metrics show cumulative count of Article Views (full-text article views including HTML views, PDF and ePub downloads, according to the available data) and Abstracts Views on Vision4Press platform.
Data correspond to usage on the plateform after 2015. The current usage metrics is available 48-96 hours after online publication and is updated daily on week days.
Initial download of the metrics may take a while.