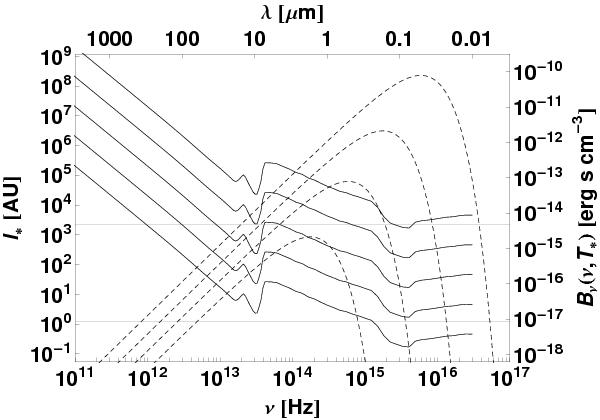
Fig. 2

The absorption length scale l∗ regarding the stellar irradiation spectrum as a function of frequency ν or wavelength λ, respectively. From top to bottom, the different solid lines denote a density of , respectively. The two horizontal lines mark the highest and lowest resolution of the spherical grid. The right vertical axis shows the scale for the stellar spectra: from top to bottom, the dashed lines denote black body spectra of T∗ = 100 000,30 000,10 000,and3000 K. The effect of potential dust evaporation is not included here, but would lead to a higher resolution of the numerical grid in terms of the irradiation spectrum.
Current usage metrics show cumulative count of Article Views (full-text article views including HTML views, PDF and ePub downloads, according to the available data) and Abstracts Views on Vision4Press platform.
Data correspond to usage on the plateform after 2015. The current usage metrics is available 48-96 hours after online publication and is updated daily on week days.
Initial download of the metrics may take a while.


