Free Access
Fig. 1
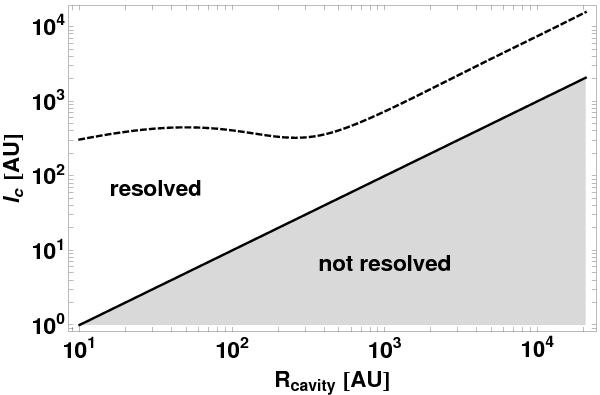
The cooling length scale lc (dashed line) of the thermal dust emission in the gray approximation as a function of the actual location of the cavity shell Rcavity. The solid line denotes the resolution of our numerical grid.
Current usage metrics show cumulative count of Article Views (full-text article views including HTML views, PDF and ePub downloads, according to the available data) and Abstracts Views on Vision4Press platform.
Data correspond to usage on the plateform after 2015. The current usage metrics is available 48-96 hours after online publication and is updated daily on week days.
Initial download of the metrics may take a while.