Fig. 12
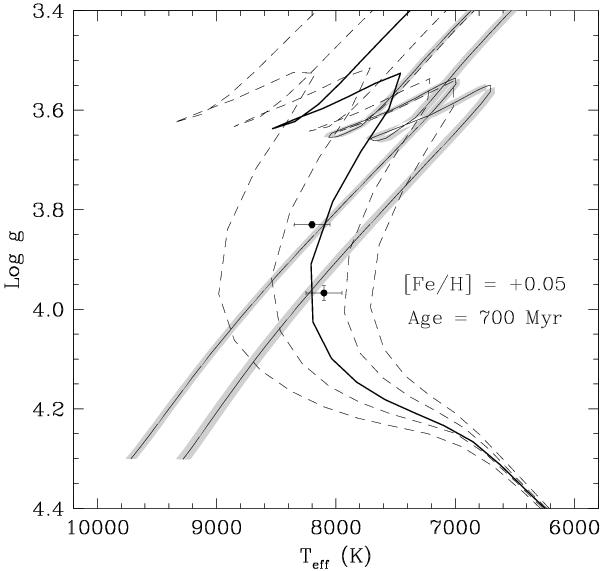
Measurements for SW CMa compared against Yonsei-Yale models by Yi et al. (2001) for [Fe/H] = + 0.05 and [α/Fe] = 0.0. Evolutionary tracks for the measured masses are shown with solid lines and shaded areas indicating the uncertainty in the location of each track coming from the mass errors. Isochrones from 500 Myr to 900 Myr in steps of 100 Myr are represented by the dashed lines. The best fitting 700 Myr isochrone is drawn with a thicker line.
Current usage metrics show cumulative count of Article Views (full-text article views including HTML views, PDF and ePub downloads, according to the available data) and Abstracts Views on Vision4Press platform.
Data correspond to usage on the plateform after 2015. The current usage metrics is available 48-96 hours after online publication and is updated daily on week days.
Initial download of the metrics may take a while.