Fig. 8
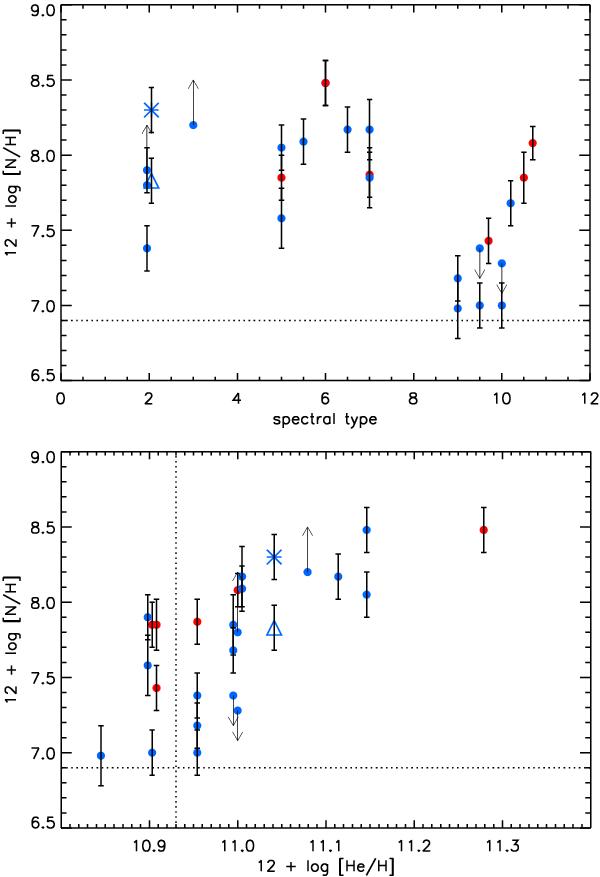
Nitrogen abundances derived for our LMC sample. Upper panel: as a function of O-star spectral type (“10−12” correspond to B0–B2; for Teff, see Table 6). Lower panel: as a function of helium content, 12 + log (He/H) = 12 + log (YHe). Red: luminosity class I − II; blue: III − V. Arrows indicate upper or lower limits. Alternative solutions for N11-031 (see Sect. 5) are indicated by a triangle and an asterisk for the cooler and hotter solution, respectively. The estimated (1-σ) error for log (YHe) is 0.05 dex. The dotted lines indicate the LMC nitrogen (Hunter et al. 2007) and the average helium (see text) baseline abundances. Some objects were slightly shifted horizontally for clarity.
Current usage metrics show cumulative count of Article Views (full-text article views including HTML views, PDF and ePub downloads, according to the available data) and Abstracts Views on Vision4Press platform.
Data correspond to usage on the plateform after 2015. The current usage metrics is available 48-96 hours after online publication and is updated daily on week days.
Initial download of the metrics may take a while.