| Issue |
A&A
Volume 537, January 2012
|
|
|---|---|---|
| Article Number | A79 | |
| Number of page(s) | 41 | |
| Section | Stellar atmospheres | |
| DOI | https://doi.org/10.1051/0004-6361/201117790 | |
| Published online | 11 January 2012 | |
Online material
Appendix A: Details of the nitrogen model atom
This section provides some details of our N ii, N iv and N v model ions (corresponding material for N iii has been already presented in Paper I). Configurations and term designations are outlined in Tables A.1−A.3, whilst Figs. A.1−A.3 display the Grotrian diagrams for the N ii singlet and triplet system (the quintet system comprises five levels only), the N iv singlet and triplet system, and the N v doublet system, respectively. In these figures, important optical transitions as given in Table 2 are indicated as well.
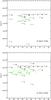 |
Fig. A.1
Grotrian diagrams for the N ii singlet (upper panel) and triplet (lower panel) systems. Level designations refer to Table A.1. Important optical transitions are indicated by green lines and numbers referring to entries in Table 2. |
| Open with DEXTER | |
Electronic configurations and term designations of our N ii model ion.
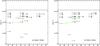 |
Fig. A.2
As Fig. A.1, but for the N iv singlet (left) and triplet (right) system. Level numbers refer to Table A.2. |
| Open with DEXTER | |
Electronic configurations and term designations of our N iv model ion.
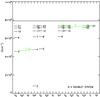 |
Fig. A.3
As Fig. A.1, but for the N v model ion. Level numbers refer to Table A.3. |
| Open with DEXTER | |
Electronic configurations and term designations of our N v model ion.
Appendix B: Tests of the N II model ion
Figures B.1 to B.7 refer to tests of our N ii model ion, as described in Sect. 2.2.1. Figure B.1 compares electron temperatures and densities for B-star parameters calculated by fastwind and tlusty, whilst Figs. B.2 to B.7 compare corresponding synthetic N ii line profiles from these two codes and from calculations by Przybilla et al. (priv. comm.).
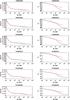 |
Fig. B.1
fastwind (black) vs. tlusty (red): comparison of electron temperature and electron density as a function of Rosseland optical depth for the six models corresponding to Figs. B.2 to B.7. |
| Open with DEXTER | |
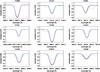 |
Fig. B.2
Comparison of important optical N ii line profiles for a model with Teff = 20 kK and log g = 3.0, for models – see Table 1 – FW (black), FW2 (red), TL (green) and Prz (blue). Note that N ii λ 3995 is not present in the BSTAR2006 grid. |
| Open with DEXTER | |
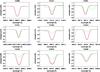 |
Fig. B.3
As Fig. B.2, but for Teff = 20 kK and log g = 2.5, for models FW (black), FW2 (red), and TL (green). |
| Open with DEXTER | |
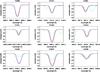 |
Fig. B.4
As Fig. B.2, but for Teff = 24 kK and log g = 3.0. |
| Open with DEXTER | |
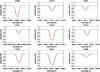 |
Fig. B.5
As Fig. B.3, but for Teff = 24 kK and log g = 2.75. |
| Open with DEXTER | |
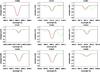 |
Fig. B.6
As Fig. B.3, but for Teff = 27.5 kK and log g = 3.5. |
| Open with DEXTER | |
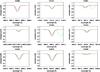 |
Fig. B.7
As Fig. B.3, but for Teff = 27.5 kK and log g = 3.0. |
| Open with DEXTER | |
Appendix C: Line fits for individual objects
Figures C.1 to C.22 display the observed (green) and best-fitting optical nitrogen spectra (black) for all our objects, except for N11-072, N11-032, and BI237, which are contained in the main section. Blue and red spectra show corresponding synthetic line profiles with [N] at the lower and upper limit, respectively. For N11-031 (Fig. C.7), we show the fits corresponding to the two alternative solutions for this star (see Sect. 5). For details on the line fits, see Sect. 5, and for adopted stellar parameters and derived nitrogen abundances inspect Tables 4 and 6, respectively. All fits are based on unclumped winds except when explicitly stated.
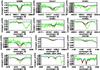 |
Fig. C.1
N11-029 – O9.7 Ib. Observed (green) and best-fitting optical nitrogen spectrum (black). Blue and red spectra correspond to synthetic line profiles with [N] at the lower and upper limit, respectively. For details, see Sect. 5. |
| Open with DEXTER | |
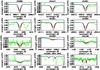 |
Fig. C.2
N11-036 – B0.5 Ib. |
| Open with DEXTER | |
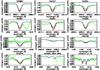 |
Fig. C.3
N11-008 – B0.7 Ia. |
| Open with DEXTER | |
 |
Fig. C.4
N11-042 – B0 III. |
| Open with DEXTER | |
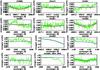 |
Fig. C.5
N11-033 – B0 IIIn. |
| Open with DEXTER | |
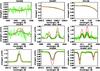 |
Fig. C.6
N11-026 – O2 III(f∗). |
| Open with DEXTER | |
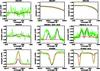 |
Fig. C.7
N11-031 – ON2 III(f∗). Black: cooler solution, supported by He iλ4471, N iii and N ivλ6380. Red: hotter solution, supported by the N iv/N v lines (see Sect. 5). |
| Open with DEXTER | |
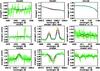 |
Fig. C.8
N11-038 – O5 II(f+). |
| Open with DEXTER | |
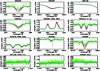 |
Fig. C.9
Sk–66° 100 – O6 II(f). |
| Open with DEXTER | |
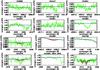 |
Fig. C.10
N11-045 – O9 III. |
| Open with DEXTER | |
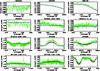 |
Fig. C.11
BI253 – O2 V((f∗)). |
| Open with DEXTER | |
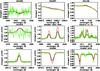 |
Fig. C.12
N11-060 – O3 V((f∗)). |
| Open with DEXTER | |
 |
Fig. C.13
Sk–70° 69 – O5 V((f)). For this star, the N iv multiplet at 7103 − 7129 Å has not been observed. |
| Open with DEXTER | |
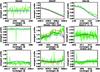 |
Fig. C.14
N11-051– O5 Vn((f)). |
| Open with DEXTER | |
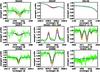 |
Fig. C.15
N11-058 – O5.5 V((f)). |
| Open with DEXTER | |
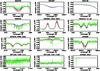 |
Fig. C.16
Sk–66° 18 – O6 V((f)). Magenta spectra correspond to a weakly clumped model. For details, see Sect. 5. |
| Open with DEXTER | |
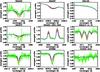 |
Fig. C.17
N11-065 – O6.5 V((f)). |
| Open with DEXTER | |
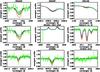 |
Fig. C.18
N11-066 – O7 V((f)). |
| Open with DEXTER | |
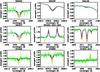 |
Fig. C.19
N11-068 – O7 V((f)). |
| Open with DEXTER | |
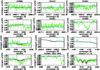 |
Fig. C.20
N11-061 – O9 V. |
| Open with DEXTER | |
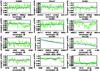 |
Fig. C.21
N11-123 – O9.5 V. |
| Open with DEXTER | |
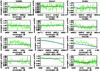 |
Fig. C.22
N11-087 – O9.5 Vn. |
| Open with DEXTER | |
© ESO, 2012
Current usage metrics show cumulative count of Article Views (full-text article views including HTML views, PDF and ePub downloads, according to the available data) and Abstracts Views on Vision4Press platform.
Data correspond to usage on the plateform after 2015. The current usage metrics is available 48-96 hours after online publication and is updated daily on week days.
Initial download of the metrics may take a while.