Fig. 12
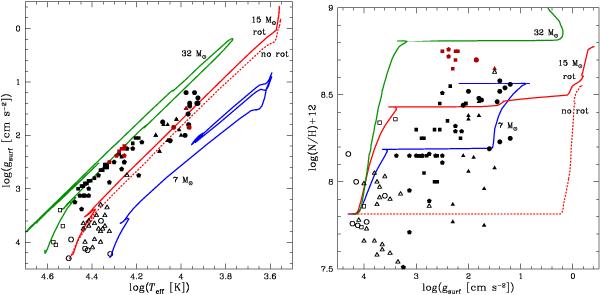
log (g) − log (Teff) diagram (left) and evolution of the abundance ratio N/H (right) for the 7 (blue), 15 (red), and 32 M⊙ (green) rotating models. The track of the non-rotating 15 M⊙ is indicated with the red dotted line. Observational points from O- and B-type stars are plotted, with empty symbols for luminosity class (LC) V-III (triangles: Morel et al. 2008; squares: Villamariz et al. 2002, Villamariz & Herrero 2005; circles: Przybilla et al. 2010) and filled symbols for LC I (triangles: Takeda & Takada-Hidai 2000; squares: Crowther et al. 2006; hexagons: Searle et al. 2008; circles: Przybilla et al. 2010).
Current usage metrics show cumulative count of Article Views (full-text article views including HTML views, PDF and ePub downloads, according to the available data) and Abstracts Views on Vision4Press platform.
Data correspond to usage on the plateform after 2015. The current usage metrics is available 48-96 hours after online publication and is updated daily on week days.
Initial download of the metrics may take a while.