Fig. 9
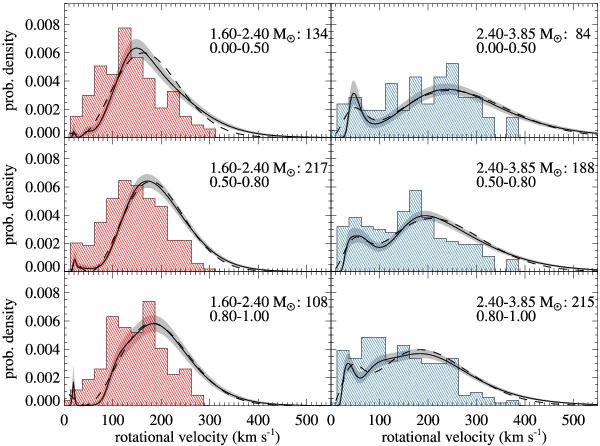
Distributions of rotational velocities as a function of age for two mass subsamples. Left panels correspond to the low-mass bin: 1.6–2.4 M⊙ and right panels correspond to the high-mass bin: 2.4–3.85 M⊙. As in Fig. 6, shaded histograms are the observed vsini; solid thick lines are the distributions of equatorial velocities v and the gray strips are their associated variability bands. The mass range for each subsample is indicated in the corresponding panel together with the number of stars, and below, the age interval is indicated and goes from young stars (0 < t/tMS < 0.5) in upper panels to stars close to the TAMS (0.8 < t/tMS < 1) in lower panels. The histograms are normalized to fit the probability density scale.
Current usage metrics show cumulative count of Article Views (full-text article views including HTML views, PDF and ePub downloads, according to the available data) and Abstracts Views on Vision4Press platform.
Data correspond to usage on the plateform after 2015. The current usage metrics is available 48-96 hours after online publication and is updated daily on week days.
Initial download of the metrics may take a while.