| Issue |
A&A
Volume 537, January 2012
|
|
|---|---|---|
| Article Number | A126 | |
| Number of page(s) | 21 | |
| Section | Extragalactic astronomy | |
| DOI | https://doi.org/10.1051/0004-6361/201117551 | |
| Published online | 19 January 2012 | |
I Zw 18 as morphological paradigm for rapidly assembling high-z galaxies
1 Centro de Astrofísica and Faculdade de Ciências, Universidade do Porto, Rua das Estrelas, 4150-762 Porto, Portugal
e-mail: papaderos@astro.up.pt
2 Department of Astronomy, Oskar Klein Centre, Stockholm University, 106 91 Stockholm, Sweden
Received: 23 June 2011
Accepted: 18 October 2011
Context.I Zw 18, ever since regarded as the prototypical blue compact dwarf (BCD) galaxy, is, quite ironically, the most atypical BCD known. This is because its large low-surface brightness (LSB) envelope is not due to an old underlying stellar host, as invariably is the case for typical BCDs, but is entirely due to extended nebular emission.
Aims. Our goal is to explore I Zw 18 and its detached C component I Zw 18 C down to an unprecedently faint surface brightness μ (mag/◻″) level in order to gain further insight into the structural properties and evolutionary history of this enigmatic galaxy pair.
Methods. We present a photometric analysis of the entire set of archival HST ACS V, R and I band data for I Zw 18.
Results. Radial color profiles for I Zw 18 C reveal blue and practically constant colors (0 ± 0.05) down to μ ~ 27.6, and a previously undisclosed, slightly redder (V − I ≈ 0.2), stellar population in its extreme periphery (μ ~ 29). We argue that stellar diffusion over τ ~ 108 yr and the associated stellar mass filtering effect can consistently account for the observed properties of the stellar component in the outskirts of I Zw 18 C. This process, in combination with propagating star formation with a mean velocity of ~20 km s-1 can reproduce all essential characteristics of I Zw 18 C within ~τ. An extremely faint substrate of older stars cannot be ruled out but does not need to be postulated. As for I Zw 18, we find that nebular emission (ne) extends out to ~16 stellar scale lengths, shows a nearly exponential outer profile, and provides at least one third of the total optical emission. Nebular emission dominates already at μ ~ 23.5, as evident from e.g. the uniform and extremely blue (V − I ≈ –1, R − I ≈ –1.4) colors of the LSB envelope of I Zw 18.
Conclusions. The case of I Zw 18 suggests caution in studies of distant galaxies in dominant stages of their evolution, rapidly assembling their stellar mass at high specific star formation rates (SSFRs). It calls attention to the fact of ne not necessarily being cospatial with the underlying ionizing and non-ionizing stellar background. It also does not have to scale with the background surface density. The prodigious energetic output during dominant phases of galaxy evolution may result in large exponential ne envelopes, extending much beyond the still compact stellar component, just like in I Zw 18. Therefore, the morphological paradigm of I Zw 18, while probably unique in the nearby Universe, may be ubiquitous among high-SSFR galaxies at high redshift. Using I Zw 18 as reference, we show that extended ne may introduce substantial observational biases and affect several of the commonly studied fundamental galaxy relations. Among others, we show that the surface brightness profiles of distant morphological analogs to I Zw 18 may be barely distinguishable from Sérsic profiles with an exponent 2 ≲ η ≲ 5, thus mimicking the profiles of massive galaxy spheroids.
Key words: galaxies: structure / galaxies: evolution / galaxies: dwarf / galaxies: high-redshift / galaxies: halos / galaxies: starburst
© ESO, 2012
1. Introduction
Even four decades after its discovery (Sargent & Searle 1970), the blue compact dwarf (BCD) galaxy I Zw 18 continues to attract considerable interest and feed intense debates in extragalactic research. Its low oxygen abundance (Searle & Sargent 1972), established in numerous subsequent studies (Lequeux et al. 1979; French 1980; Kinman & Davidson 1981; Pagel et al. 1992; Skillman & Kennicutt 1993; Martin 1996; Vílchez & Iglesias-Páramo 1998; Izotov & Thuan 1998a,b; Izotov et al. 1999b, among others) to be 12 + log(O/H) ≈ 7.2, makes it the third most metal-poor star-forming (SF) galaxy in the nearby Universe, after SBS 0335-052 W (Izotov et al. 2005; Papaderos et al. 2006a; Izotov et al. 2009) and DDO68 (Pustilnik et al. 2005; Izotov & Thuan 2007). Despite a meanwhile long record of extremely metal-poor BCDs (12 + log(O/H) ≲ 7.6; hereafter XBCDs) discovered in the recent years (see e.g. Papaderos et al. 2008; Guseva et al. 2009, for a review), I Zw 18 remains the unconquered prototypical example of this enigmatic galaxy class.
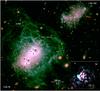 |
Fig. 1 Three-color composite image of I Zw 18 and I Zw 18 C, combining HST ACS data in V, R, and I (blue, green, and red channels, respectively). The position of the SF regions NW and SE is indicated by crosses. The regions labeled “Loop” and “Hα arc” were studied through deep Keck II long slit spectroscopy by Izotov et al. (2001a). The region ω at the southeastern tip of I Zw 18 shows comparatively weak nebular emission, its colors therefore allow meaningful constraints to be placed on the age of the stellar component (Papaderos et al. 2002). In the magnified version of region NW (inset), combining the unsharp masked images Ic, Rc, and Vc (see Sect. 3 for details), about 30 point sources, surrounded by a complex network of ionized gas shells are discernible. The irregular blue galaxy I Zw 18 C is located ~22′′ northwest of region NW ( ≈ 2 kpc at the assumed distance of 19 Mpc to I Zw 18). It shows faint nebular emission in its bluer southeastern tip and central star cluster complex C (Izotov et al. 2001a). North is at the top and east to the left. |
I Zw 18 was originally described by Zwicky (1966) as a pair of compact galaxies, later on recognized to be SF regions within the same galaxy, the brighter northwestern and the fainter southeastern component, referred to as regions NW and SE, which are separated by ≈ 6′′ (cf. Fig. 1). Subsequent work has shown that these regions are embedded within an extended, low-surface brightness (LSB) envelope (Davidson et al. 1989; Dufour & Hester 1990; Östlin et al. 1996; Dufour et al. 1996a; Martin 1996), whose rich filamentary substructure was impressively revealed with the advent of the HST (Hunter & Thronson 1995; Dufour et al. 1996b). That nebular emission (hereafter ne) is very strong in the central part of I Zw 18 and its northwestern supershell was spectroscopically documented early on. For example, Izotov et al. (2001a) have shown, on the basis of deep long slit spectroscopy, that the equivalent width (EW) of the Hα emission line rises to 1700 Å northwest of region NW and that ne is present as far away as 15′′ from it (regions labeled “Hα arc” and “Loop” in Fig. 1). The EW(Hα) morphology of I Zw 18 was first studied with high-resolution, ground-based imagery by Östlin et al. (1996) who described a horseshoe-shaped rim of intense (EW(Hα) ≃ 1500 Å) ne encompassing region NW. This conspicuous EW pattern was later confirmed through HST WFPC2 data (Papaderos et al. 2001; Izotov et al. 2001a) and, more impressively, by Vílchez & Iglesias-Páramo (1998) who were the first to present a 2D spectroscopic study of the chemical abundance patterns of the warm interstellar medium (ISM) in I Zw 18.
Much less attention has been attracted by the fainter detached C component of I Zw 18 (hereafter I Zw 18 C), located ~22′′ northwest of region NW. Dufour et al. (1996a), Petrosian et al. (1997), Izotov & Thuan (1998a), van Zee et al. (1998) and Izotov et al. (2001a) have shown it to have the same recession velocity as the main body, thus establishing its physical association to I Zw 18. This was also shown through interferometric 21 cm studies (van Zee et al. 1998; see also Viallefond et al. 1987) which revealed that I Zw 18 and I Zw 18 C are immersed within a large common HI complex with a projected size of 60′′ × 45′′ connecting with a ≳ 1′ southern tail with no optical counterpart. The SF activity in I Zw 18 C is known to be weak with its EW(Hα) not exceeding ~60 Å along its major axis (Izotov et al. 2001a, see also van Zee et al. 1998). Despite deep Keck II spectroscopy, Izotov et al. (2001a) failed to detect oxygen lines, so its oxygen abundance is not known.
Traditionally, the distance to I Zw 18 has been taken to be 10 Mpc, assuming a pure Hubble flow recessional velocity. However, Izotov et al. (1999a), based on an HST color-magnitude diagram (CMD) study, have argued that the distance to I Zw 18 has to be at least 15 Mpc, and most likely ~20 Mpc, in order for its brightest stars being massive enough to account for the ionizing flux observed. This upper distance value has recently received independent support by Fiorentino et al. (2010). These authors identify three long-period Cepheid candidates in I Zw 18, which, if interpreted as classical Cepheids, imply a distance of 19.0 Mpc by the Wesenheit relation. In the following, we adopt a distance D = 19 Mpc to both I Zw 18 and I Zw 18 C throughout and convert distance-dependent quantities from the literature accordingly. It should be noted, however, that the assumed distance has practically no influence on the main conclusions from this study.
The wealth of dedicated studies of I Zw 18 highlight the importance placed on this XBCD as a precious nearby laboratory for exploring collective star formation and the associated feedback process under metallicity conditions approaching those in distant protogalactic systems. Some examples include (i) the consideration of I Zw 18 as reference object for many dwarf galaxy chemical evolution models (Matteucci & Tosi 1985; Roy & Kunth 1995; Mas-Hesse & Kunth 1999; Legrand 2000; Recchi et al. 2004, among others); (ii) the great deal of effort put in determining its chemical abundance patterns in its neutral ISM (Kunth et al. 1994; Aloisi et al. 2003; Lecavelier des Etangs et al. 2004); (iii) the study of its dust and molecular gas content (e.g. Cannon et al. 2002; Leroy et al. 2007); (iv) the thorough exploration of the excitation mechanisms of its brightest Hii region (Stasińska & Schaerer 1999; Péquignot 2008); and (v) the deep spectroscopic studies that led to the discovery of Wolf-Rayet stellar features in it (Izotov et al. 1997b; Legrand et al. 1997).
But arguably, the most longstanding debate associated with I Zw 18 ever since its discovery concerns its evolutionary status. In this regard, various interpretations have been put forward, ranging from I Zw 18 being a bona fide young galaxy, currently forming its first stellar generation (Sargent & Searle 1970, see also Izotov & Thuan 1999), through the diametrically opposite picture of an ancient “slowly cooking” dwarf galaxy that is forming stars continuously over the Hubble time (Legrand 2000; Legrand et al. 2001). Notwithstanding an impressive amount of high-quality multiwavelength data and numerous dedicated analyses of considerable effort and sophistication, the convergence towards a consensual view on the evolutionary status of I Zw 18 has been slow.
CMD analyses, based on HST data, have primarily been focusing on the question of whether I Zw 18 contains a sizeable population of evolved red giant branch (RGB) stars, similar to typical (12 + log(O/H) ≳ 8, see e.g. Kunth & Östlin 2000) BCDs. In the latter, an extended envelope of resolved RGB stars around the SF component (e.g. Tosi et al. 2001; Crone et al. 2002) nicely echoes the since-long observationally established fact of an evolved underlying host galaxy in these systems (e.g. Loose & Thuan 1986; Papaderos et al. 1996a; Cairós et al. 2001; Bergvall & Östlin 2002; Noeske et al. 2003; Gil de Paz & Madore 2005). Initial CMD studies suggested an age for the main body between several 10 Myr (Hunter & Thronson 1995; Dufour et al. 1996b) and ~1 Gyr (Aloisi et al. 1999). Östlin (2000) argues from an HST NICMOS near infrared (NIR) study that a fit to the J vs. J − H CMD of I Zw 18 is best achieved for a stellar population of age ~ 5 Gyr. The subsequent identification of five carbon star candidates with an estimated age 0.5–1 Gyr by Östlin & Mouhcine (2005) is in accord with that conclusion, even though the number of evolved star candidates in all above studies (about a dozen altogether) was recognized to be surprisingly small compared to typical BCDs of equal luminosity. A significant step forward has been possible through the advent of HST ACS, allowing point source photometry to be extended to magnitudes as faint as 29 mag in the V and I bands and the question of the presence of RGB stars in I Zw 18 to be revisited (Izotov & Thuan 2004, hereafter IT04). IT04 found, in addition to numerous blue main sequence and blue and red supergiants with an age ≲ 100 Myr, an older population of asymptotic giant branch stars with an age between 0.1 and 0.5 Gyr. This study, in which no RGB stars were detected, has been the first to also explore the spatial distribution of stars of different ages in I Zw 18. The upper age limit of 0.5 Gyr for the oldest stars in I Zw 18 (IT04) was subsequently relaxed from a reanalysis of the same data by Yakobchuk & Izotov (2006) that reveals an untypically small number of RGB candidates. Various other efforts have been made to improve on the CMD analysis of IT04 by pushing point source photometry to fainter levels by 1–2 mag (Momany et al. 2005; Tosi et al. 2007; Tikhonov 2007). The faintest ( > 29 mag) point sources in those CMDs almost uniformly cover the color range between < –1 mag and > 2 mag. It is worth pointing out that, although divergent in their conclusions regarding stellar age, all CMD analyses for I Zw 18 consistently indicate a conspicuous absence of an extended stellar LSB envelope surrounding regions NW&SE, in sharp contrast to any previously studied BCD.
As for I Zw 18 C, CMD analyses yield an upper age between a few ten and hundred Myr (Dufour et al. 1996b; Aloisi et al. 1999). Recently, Jamet et al. (2010) has employed a probabilistic CMD modeling technique and reports an upper age of ~125 Myr, without, however, strictly ruling out the presence of older stars. An age of the same order was previously inferred for I Zw 18 C from a combined CMD and evolutionary spectral synthesis study by Izotov et al. (2001a).
From the viewpoint of surface photometry, diametrically different conclusions on the photometric structure and evolutionary status of I Zw 18 were drawn by Kunth & Östlin (2000, hereafter KÖ00) and Papaderos et al. (2002, hereafter P02). Nevertheless, these two studies were the first to demonstrate on the basis of surface photometry that I Zw 18 is not presently forming its first stellar generation but contains a substantial unresolved stellar background of intermediate age.
As a matter of fact, much of the disparity between these studies has stemmed from the differing importance they ascribed to the presence and photometric impact of ne. KÖ00 concluded that SF activity in I Zw 18 is hosted by an old, extended stellar disk that dominates the stellar mass, just like in typical BCDs. Their rationale has mainly been based on their finding that I Zw 18 shows an exponential intensity decrease and reddish (B − R ≈ 0.6 mag) colors in its LSB envelope (9′′ ≳ R⋆ ≲ 20′′). On the assumption that stellar emission dominates throughout, this color translates via a continuous star formation model to an age of ≳ 5 Gyr. The central surface brightness μ0 and exponential scale length α of the disk, read off the B band surface brightness profile (SBP) of KÖ00, imply that the old stellar host contains ~1/2 of the emission and the bulk of the stellar mass in I Zw 18. The stellar disk interpretation for I Zw 18 qualitatively agrees with the evolutionary scenario by Legrand et al. (2001, see also Legrand 2000. These authors argue that the low and uniform gas-phase metallicity of I Zw 18 can be reproduced through continuous low-level star formation throughout the main HI complex of I Zw 18 (45′′ × 60′′) over the past ~14 Gyr. This process would produce an extended stellar disk of extremely low surface brightness ( B mag/◻″).
P02 (see also Papaderos et al. 2001), on the other hand, called the conclusions by KÖ00 into question by invoking various lines of observational evidence. First, they have empirically shown that an exponential outer intensity drop off is a generic property of the nebular halo of starbursting dwarf galaxies. Consequently, the exponentiality of the LSB envelope of I Zw 18 is not per se a compelling argument for it being a stellar disk. This also applies to its reddish colors, which can naturally be accounted for by photoionized gas of subsolar metallicity (see e.g. Krüger et al. 1995).
Second, and in a more straightforward approach, P02 used HST WFPC2 narrow band images to bidimensionally subtract the [Oiii] and Hα line emission from broad band HST data in order to isolate and study the residual stellar emission in I Zw 18. This correction led to the virtual removal of the filamentary LSB envelope, proving its gaseous nature. Specifically, P02 have shown that ne already dominates the line-of-sight intensity at a photometric radius R⋆ ≳ 6′′ and contributes between 30% and 50% of the R band luminosity of I Zw 18.
After decontamination from nebular line emission (though still affected by nebular continuum emission), broad band images were then used to study the photometric structure and color distribution of the stellar component of I Zw 18. SBPs computed from them have revealed a very compact host that, in sharp contrast to typical BCDs, shows practically no radial color gradients and overall very blue ( ≲ 0.1 mag) colors down to a limiting surface brightness μ ~ 26 mag/◻″.
These exceptional properties were interpreted as evidence of youth: young stars in I Zw 18 did not have had enough time to migrate significantly far from their initial locus and gradually form the extended stellar host that is typical of evolved BCDs. This, and the blue optical and NIR colors of the southeastern tip of I Zw 18 (region ω in the notation of P02, cf. Fig. 1) where ne is weak led P02 to conclude that most of the stellar mass in I Zw 18 has formed within the past 0.5 Gyr. Hence, the picture put forward by P02 is that I Zw 18 is a cosmologically young object that presently undergoes its dominant formation phase and contains a small, if any, mass fraction of stars older than ~1 Gyr. Further support for this conclusion came from a subsequent NIR study of I Zw 18 by Hunt et al. (2003).
As for I Zw 18 C, the nearly constant blue colors ( ≈ 0 mag) determined within its Holmberg radius, lent further support to the youth interpretation that was previously advocated by Izotov et al. (2001a).
However, important aspects of the I Zw 18 system could not be conclusively addressed in previous photometric studies. For example, whereas SBPs for I Zw 18 C by P02 reach a surface brightness level μ ~ 28 B mag/◻″, their large photometric uncertainties already below ≈ 26 mag/◻″ have practically prevented an assessment of the question of whether a redder underlying stellar population dominates in the extremely faint periphery of the galaxy. Clearly, this issue is central to understanding the evolutionary status of I Zw 18 C. One may argue that, since the evolved stellar host generally dominates for μ ≳ 24.5 B mag/◻″ (Papaderos et al. 1996a, hereafter P96a), it would have been detected in I Zw 18 C, if present. This is a circular argument, however, given that empirical relations established for typical BCDs should not be taken for granted for young dwarf galaxy candidates. Similarly, due to the shallowness of previous surface photometry no definite conclusions could be drawn regarding the ultra-LSB disk predicted by Legrand (2000).
As for the main body of I Zw 18, previous studies did not have the sensitivity to pin down the maximal extent, morphology, and color pattern of the LSB envelope, adding potentially important constraints to chemodynamical and spectrophotometric models for I Zw 18. From such considerations, extremely deep surface photometry appears crucial to further advancing our understanding of the photometric structure and evolutionary status of I Zw 18 and I Zw 18 C. This is particularly true for deep I band surface photometry, which is entirely lacking both for I Zw 18 and I Zw 18 C. The I band HST WFPC2 images included the main body of I Zw 18 only and were not deep enough for a study of its LSB envelope. This data set was therefore not used in the surface photometry analysis by P02.
This study is motivated by the availability of an unprecedently deep set of archival HST ACS V, R, and I broad band data that has accumulated over the past few years. I band photometry is an important asset in this respect, not only due to its higher sensitivity to a putative old stellar background but also because it offers, in combination with V and R data, a sensitive tracer of ne both in the center and the LSB envelope of I Zw 18. This is because the I band is affected by nebular continuum emission alone, whereas the V and R transmission curves additionally include, respectively, the strong [Oiii]λλ4959, 5007 and Hα emission lines. As a result, regions with strongly enhanced ne can be identified readily by their extremely blue (–0.5 ...–1.4) V − I and R − I colors (see e.g. Papaderos et al. 1998, P02 and references therein for a discussion and examples among XBCDs).
This paper is organized as follows. In Sect. 2 we discuss the data processing and SBP derivation technique used and in Sect. 3 the structural and morphological properties of I Zw 18 C and I Zw 18. Section 4 concentrates on the evolutionary status and the formation process of I Zw 18 C (Sect. 4.1) when considering the effect that the diffusion of young stars would have on the observed colors (Sect. 4.1.1). The evolutionary status of I Zw 18 and the hypothesis of an ultra-LSB underlying stellar disk are discussed on the basis of the present photometric analysis in Sects. 4.2 and 4.2.1, respectively. In Sect. 4.3 we use I Zw 18 as template to briefly explore the biases that extended ne may introduce in photometric studies of morphologically analogous SF galaxies at higher redshift (z). The main results from this study are summarized in Sect. 5.
2. Data processing
This study is based on the entire set of archival HST ACS broad band images for I Zw 18 that has been acquired through the HST programs 9400 (PI: Thuan) and 10 586 (PI: Aloisi). It comprises 38, 65 and 81 images in the filters F555W (V), F606W (broad VR, referred to in the following as R) and F814W (I), summing up to on-source exposures of 87, 55, and 101 ks, respectively. This is the deepest imaging data set currently available for I Zw 18, with an integration time in R and I equaling about one third of the time spent on the HST ACS Ultra Deep Field (Beckwith et al. 2006) in the filters F606W and F775W.
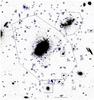 |
Fig. 2 Combined I band exposure of I Zw 18 and I Zw 18 C with point- and compact sources in the vicinity of the galaxies (polygonal regions A and B) marked with rectangles. North is up and east to the left. |
The data processing was carried out using IRAF1 and ESO MIDAS2. Photometric quantities refer to the Vega system.
Since the main goal of this study is deep surface photometry, its most critical aspect is the removal of diffuse and compact background sources (diffuse extragalactic background, zodiacal light, foreground stars, and background galaxies, respectively). After subtracting the diffuse background, we therefore checked to what extent compact or point sources (cps) within the extended LSB envelope of I Zw 18 can affect SBPs and color profiles. For example, for an extended source of constant surface brightness μ = 29 mag/◻″, the total apparent magnitude m of a circular annulus with 19′′ ≤ R⋆ ≤ 20′′ (roughly the radius of I Zw 18) is 23.8 mag. At this intensity level, already a single faint (m = 25 mag) background cps can introduce an error of 0.3 mag in surface photometry. We adopted the following procedure: after image alignment and correction for cosmics, we used the combined images in the three filters to compile a catalog of cps in the relevant portion of the field of view. In doing this, we disregarded cps in I Zw 18 (roughly the area subtended by the 25 R′ mag/◻″ isophote in Fig. 8) and in I Zw 18 C, as well as compact clumps of ne, identified by their blue V–I and R − I color. All cps in each frame were in turn replaced by the mean intensity in the adjacent area. Special care was given to the removal of two background galaxies close to the western supershell of I Zw 18. This was done by subtracting a 2D model, computed with the Bender & Möllenhoff (1987) algorithm. In total, ~140 cps were removed in the field of interest around I Zw 18 and I Zw 18 C (polygonal regions labeled A and B in Fig. 2). Their integral I magnitude of 19.17 mag and 21.3 mag within the regions considered (~1600 ◻″ and ~200 ◻″ for A and B, respectively) corresponds to a mean surface brightness of ~27 I mag/◻″. This value is consistent at the 1.5σ level with the value of 26.7 I mag/◻″ inferred by Zackrisson et al. (2009) for the resolved extragalactic background light emission. The isophotal radius of the stellar component of I Zw 18 and I Zw 18 C at μ = 26 B mag/◻″ was determined by P02 to be 8 8 and 55, respectively. From their combined isophotal area of ~340 ◻″ and the above derived cps surface density of ~0.08 ◻″-1, we expect about 27 background cps in I Zw 18 and I Zw 18 C altogether. The SBPs computed prior to and after removal of cps were found in all bands to be consistent within 1σ uncertainties, ensuring that cps contamination does not affect our conclusions in Sect. 3.
SBPs were computed with the code iv (P02) (also referred to as Lazy by Noeske et al. 2006) that was specifically developed for the study of irregular galaxies. This code permits a simultaneous processing of co-aligned images of a galaxy in several bands and does not require a choice of a galaxy center. It also does not implicitly assume that the galaxy can be approximated by the superposition of axis-symmetric luminosity components. One of its key features is the computation of photon statistics within automatically generated irregular annuli that are adjusted to the galaxy morphology for each surface brightness interval μ ± Δμ. This distinguishes code iv from other surface photometry packages that generally employ ellipse-fitting to isophotes or photon statistics within elliptical annuli (e.g. meth. i of P96a, task ELLIPSE in IRAF, FIT/ELL3 in MIDAS), or approximate a galaxy by a single or several 2D axis-symmetric components (e.g. GIM2D, Simard 1998, and GALFIT, Peng et al. 2002).
3. Results
3.1. The photometric structure of I Zw 18 C
 |
Fig. 3 a) Surface brightness profiles (SBPs) of I Zw 18 C in V (F555W), R (F606W) and I (F814W). The thick gray curve shows a fit to the V SBP for R⋆ ≥ 3 |
 |
Fig. 4 a) Three-color composite of the images Rc, Vc and Ic (red, green, and blue image channels, respectively), illustrating the spatial distribution of compact ( ≤ 0 |
In this section we investigate the photometric structure of I Zw 18 C, based on the combined HST ACS data in the filters V, R, and I. These allow extending previous HST WFPC2 surface photometry (P02) by ≳ 1 mag, with significantly reduced uncertainties below μ ~ 26 mag/◻″. In agreement with previous work, the SBPs of I Zw 18 C in all bands (Fig. 3a) were found to be nearly indistinguishable from one another, implying nearly constant radial colors. All SBPs display a narrow (R⋆ ≤ 1′′) central excess and an outer (3′′ ≲ R⋆ ≲ 9′′) roughly exponential drop-off that mainly reflects the luminosity output from the host galaxy. A salient feature at intermediate radii (1′′ ≤ R⋆ ≲ 3′′) is a shallower intensity increase than what the inward extrapolation of the outer profile slope to R⋆ = 0′′ predicts. An adequate fit to such SBPs therefore requires a modified exponential model that involves an extended (R⋆ ~ 3′′) central core of nearly constant surface brightness. One such fitting function (hereafter modexp), used by P96a to fit the host galaxy of BCDs (see Noeske et al. 2003, for applications on near infrared (NIR) studies and a comparison with the Sérsic law) takes the form ![\begin{equation} I(R^*) = I_{\rm exp} \big[1-\epsilon_1\,\exp(-P_3(R^*))\big], \label{eq:p96a} \end{equation}](/articles/aa/full_html/2012/01/aa17551-11/aa17551-11-eq68.png) (1)where P3(R ∗ ) is defined as
(1)where P3(R ∗ ) is defined as  (2)In addition to the central intensity I0 and scale length α of a pure exponential profile Iexp = I0exp(R ∗ /α), Eqs. (1) and (2) involve two other parameters: the central intensity depression ϵ1 = ΔI/I0 relative to an exponential model and the core radius Rc = ϵ2α. The best-fitting modexp model to the V band SBP for ϵ1,2 = (2.4, 0.8) (cf. P02) is shown in Fig. 3a. It yields in all bands an extrapolated central surface brightness μE,0 = 21.7 ± 0.2, a true central surface brightness μ0 = μE,0 − 2.5 log (1 − ϵ2) = 23.45 mag/◻″ and an α in the narrow range between 108 and 117 pc. The absolute V magnitude determined from the modexp fit (–11.67 mag) corresponds to ~80% of the total luminosity of I Zw 18 C.
A direct determination of the intensity profile of the host galaxy of BCDs for radii R⋆ ≤ Rc is generally prevented by the luminous young stellar component that typically dominates out to RSF ≈ 2α (Papaderos et al. 1996b, hereafter P96b). Since young stellar clusters (SCs) can hardly be sufficiently resolved and subtracted out, even at the angular resolution of the HST, the chosen parameter set ϵ1,2 has to rely on plausibility arguments (see discussion in P96a and Noeske et al. 2003) and is only to be considered approximative.
In the case of I Zw 18 C, however, due to the comparatively low surface density of young SCs, one stands a better chance of directly constraining the central form of the host’s SBP. For this, we first subtracted out the brightest ~200 point sources from the galaxy using DAOPHOT (Stetson 1979) and subsequently recomputed the V SBP from the residual emission. Figure 3c shows that this SBP closely matches the best-fitting modexp model for intermediate to large R⋆. This agreement suggests that the adopted ϵ1,2 parameters yield a reasonable first-order approximation to the unresolved emission of the host. SBP integration indicates that roughly 30% of I Zw 18 C’s emission within R80 (Fig. 3) is due to point sources. This is rather a lower limit for the luminosity fraction of cps given that with the adopted procedure SCs could not be fully deblended and subtracted out. This is apparent from the still strong (~2 mag) central peak of the V ⋆ SBP that is mainly due to incomplete removal of the central SC complex C and surrounding bright SCs (cf. Fig. 4a).
In an effort to better constrain the SBP of the unresolved stellar component of I Zw 18 C, we subsequently applied a flux-conserving unsharp masking technique (Papaderos et al. 1998, hereafter P98) to filter out all higher-surface brightness (HSB) clumpy features with ≤ 05 and isolate the diffuse V emission. The frames holding the compact (Vc, Rc, and Ic) and diffuse (Vd, Rd, and Id) emission in each band are displayed in panels a and b of Fig. 4, respectively. The Vd SBP (Fig. 3c) is at intermediate radii (1′′ ≲ R⋆ ≲ 6′′) fairly comparable to the V⋆ SBP, except for a nearly constant offset by ≈ 0.3 mag. Its corresponding absolute magnitude (–11.3 mag) is by about 0.75mag fainter than the integral value for I Zw 18 C (–12.05 mag) and can be regarded as characteristic for the unresolved stellar emission in the host galaxy.
All SBPs in Figs. 3a,c display at very faint levels (μ ≳ 27.6 mag/◻″) a shallower outer (R⋆ ≳ 6′′) exponential slope (Fig. 3a). This feature is certainly not due to point spread function (PSF) convolution effects since the maximum extent of the ACS PSF at its lowest measured intensity (10 mag below its central value) is ~15 (Jee et al. 2007). Nebular emission contamination from the main body can as well be excluded both on the basis of narrow-band imaging (e.g. Östlin et al. 1996, P02) and because it would make V − I and R − I color profiles bluer, in disagreement with their slightly redder values for R⋆ ≳ 6′′ (see below). This outermost SBP feature has evaded detection in previous surface photometry (P02) which, due to photometric uncertainties, was practically restricted to within the Holmberg radius. Because of its faintness (merely 3% of the total emission) and low surface brightness (~27.6–29 mag/◻″), its reality cannot be established beyond doubt even with the present data. If an underlying stellar host of constant exponential slope to R⋆ = 0′′, then its μ0 ( ≈ 23.6 mag/◻″) and α (160 pc) would qualify it as an LSB dwarf with an MV ≈ −11 mag (equivalent to ~38% of I Zw 18 C’s emission).
We turn next to the color distribution in I Zw 18 C. Figure 3b shows that, for 1′′ ≲ R⋆ ≲ 6′′, both the V − R and R − I indexes are very blue and nearly constant ( ≈ 0 with a standard deviation about the mean of 0.05 mag). Since R⋆ = 6′′ encompasses practically all the emission of I Zw 18 C, this color may be regarded as representative of the galaxy as a whole. In the outermost periphery of the galaxy, where the shallower outer exponential component appears, color profiles hold a hint of a slightly redder R − I (0.16 ± 0.09) without a notable change in V–R. The color profiles in their innermost (R⋆ ≤ 1′′) part are dominated by luminous cps in the surroundings of region C (cf. Fig. 1) and show a large scatter (up to 0.15 mag) around mean values of 0 mag for V − R and 0.06 mag for R − I.
To place meaningful constraints on the evolutionary status of I Zw 18 C, it is necessary to verify that these blue colors do not simply result from the luminosity-weighted average of bright blue SCs with a red underlying stellar background. The latter could readily escape detection, even when dominating the stellar mass (see e.g. P98). This concern is underscored by two atypical properties of I Zw 18 C: First, the galaxy exhibits a weak color gradient along its major axis (cf. Aloisi et al. 1999; Izotov et al. 2001a), with its northwestern tip being redder (B − V = 0.05 mag, V − I = 0.2 mag) than the southeastern one (B − V = −0.07 mag and V − I = −0.2 mag). This is apparent from Fig. 4c, from which a V − I color as blue as –0.2 mag can be read off all over the southeastern third of the galaxy (region C i in the denomination by IT04). In contrast, the average V − I color in the central (C ii) and northwestern (C iii) part of the galaxy is redder ( ≥ 0 mag) with several local color maxima ( ≥ 0.3 mag) associated with cps. It is thus conceivable that the bluer southeastern and redder northwestern galaxy half counterbalance each other, thereby introducing an overall blue mean radial color. Another characteristic of I Zw 18 C that could additionally conspire in diminishing radial color gradients is that the surface density of its cps tends to be spatially anti-correlated with the unresolved stellar background of the host. This is illustrated in Fig. 4d, where the diffuse emission of the latter (Id: red channel) is overlaid with the cps in the Vc and Rc images (blue and green channels, respectively). It can be seen that the diffuse component peaks at the northwestern half of I Zw 18 C (C ii and C iii) in which it accounts for ≈ 50% of the V line-of-sight intensity, whereas its contribution drops to ≲ 30% in the southeastern half of I Zw 18 C (region C i) where most of the bright blue cps are located. Consequently, especially in region C i, a hypothetical red stellar background could readily escape detection on radial color profiles.
From such considerations, and in order to infer the colors of the unresolved stellar component of I Zw 18 C in an as unbiased manner as possible, we also computed color profiles based on Vd, Rd, and Id SBPs. In all cases, we found good agreement with the results initially obtained from the total emission with the exception of a central (R⋆ ≲ 1′′) red peak with mean values of (V − R)d = 0.1 ± 0.03 and (V − I)d = 0.16 ± 0.05. This color excess might be attributed to a stellar age gradient or enhanced extinction in region C and surroundings. From spectral synthesis models, Izotov et al. (2001a) estimates an extinction coefficient C(Hβ) = 0.1–0.3 for region C, corresponding to AV = 0.2–0.65 mag.
 |
Fig. 5 (upper panel) V, R, and I SBPs of I Zw 18. The thick-solid and thin-dashed lines show linear fits to the V SBP in the radius range 7′′ ≤ R⋆ ≤ 15′′ and R⋆ ≥ 7′′, respectively. The effective radius Reff and the radius R80 enclosing 80% of the total V emission are indicated. The V SBP derived by P02 after subtraction of the Hβ and [Oiii]λλ4959, 5007 emission lines (referred to as V′), shifted by +1 mag for the sake of clarity, is included for comparison. (lower panel) V − R (filled circles), V − I (squares), and R − I (open circles) color profiles, computed from the SBPs in the upper panel. The vertical bar indicates the V − I color range inferred by P02 from ground-based and HST PC data for region ω at the southeastern tip of I Zw 18 (V − I(ω) = 0.17 ...0.32 mag). The mean V − R color of I Zw 18’s host after subtraction of nebular line emission (V′ – R′ = 0.12 ± 0.04 mag; P02) is indicated by the horizontal line. The colors V − I(ω) and V′ – R′ of the stellar host galaxy are by, respectively, ≳ 0.8 mag redder and ≈ 0.4 mag bluer than the colors of the exponential nebular envelope (R⋆ ≥ 6′′). |
As is apparent from panel d of Fig. 3, the (V − I)d profile is fairly comparable to the V − R and R − I profiles (panel b), revealing a nearly constant color of ≈0 ± 0.04 mag within 1′′ ≤ R⋆ ≤ 6′′ and a slightly redder value (0.2 ± 0.08 mag) in the extreme periphery of the galaxy. We are therefore led to conclude that the overall blue colors of I Zw 18 C for 1′′ ≲ R⋆ ≲ 6′′are not dictated by bright young SCs spread over the body of the galaxy but characteristic of its unresolved stellar component.
3.2. The photometric structure of I Zw 18
 |
Fig. 6 V − R (left panel) and R − I (right panel) color map of I Zw 18, displayed in the range between 0 and 0.4 mag and –0.9 and 0 mag, respectively. Crosses mark the SF regions NW and SE. The region termed ω by P02 (cf. Fig. 1) is indicated at the southeastern part of the image. The insets in the left panel show a magnified view of a shell ≈ 5′′ northward of region NW. |
The V, R, and I SBPs of I Zw 18 (Fig. 5) compare well to those presented by KÖ00 and P02. They exhibit a central (R⋆ ≲ 6′′) HSB core and a nearly exponential LSB envelope extending out to R⋆ ~ 20′′. Profile fitting in the radius range 7′′ ≤ R⋆ ≤ 15′′ yields an  (210 pc) and a luminosity fraction of ≈ 30% for the LSB component. At fainter levels ( ≳ 27.6–30 mag/◻″) all SBPs exhibit a shallower exponential slope with
  (370 pc). This SBP feature is attributable to the faint filamentary emission in the extreme northwestern and southeastern periphery of I Zw 18 (cf. Fig. 8) that has evaded detection on previous HST WFPC2 imagery and which accounts for no more than 1% of the total luminosity. A linear fit to the whole LSB envelope (7′′ ≤ R⋆ ≤ 20′′) yields a mean
  (~270 pc).
The radial color profiles of I Zw 18 (lower panel of Fig. 5) reflect the increasing contribution of ne to the observed line-of-sight intensity with increasing galactocentric radius, in agreement with previous evidence (P02). The V − R color increases roughly linearly from ≲ 0 at R⋆ = 0′′ to 0.55 mag at R⋆ = 9′′ where it levels off to a nearly constant value. The corresponding, relatively strong color gradient of γ + = 0.6 mag kpc-1 is fairly typical of evolved BCDs (P96b), suggesting, at first glance, that SF activity in I Zw 18 occurs within a more extended, old underlying host. This interpretation is, however, immediately challenged upon inspection of the extremely blue V − I and R − I profiles. The latter display already in their inner part (2′′ ≲ R⋆ ≤ 6′′) mean values of –0.21 mag and –0.44 mag, respectively, both inconsistent with the red V − R color, if the emission is assumed to be dominated by stars. More impressively, at R⋆ ~ 6′′, i.e. roughly at the transition radius between the HSB core and the exponential LSB envelope of SBPs, either color index shows a sudden decrease to values as blue as V − I = –0.61 ± 0.13 mag and R − I = –1.1 ± 0.08 mag, which then remain nearly constant out to R⋆ ~ 20′′.
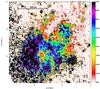 |
Fig. 7 V − I map of the central 15 |
That such colors cannot be of stellar origin is apparent already from the fact that, even for an O5V star, the V − I color is –0.32 mag and R − I is –0.18 mag, i.e. 0.3 to 0.9 mag redder than the color of the LSB envelope of I Zw 18. More generally, as pointed out by P02, there is no stellar population, regardless of star formation history, age, and metallicity, that can reproduce the observed combination of red (~0.6 mag) V − R with blue (–0.6 ...–1.1 mag) V − I and R − I colors of the LSB envelope of I Zw 18. Quite the contrary, such colors can be accounted for solely by ne.
 |
Fig. 8 Composite image of I Zw 18 and I Zw 18 C with the R, I, and V bands shown in the red, green, and blue channels, respectively. The contours, adapted from P02, are computed from HST WFPC2 R data, after 2D subtraction of the Hα emission (referred to as R′), they thus delineate the morphology of the stellar and nebular continuum emission in the main body of I Zw 18. Contours go from 19 to 25 R′ in steps of 0.5 mag. |
Indeed, comparison of our Fig. 5 and Fig. 12 of P02 reveals that the radius R⋆ = 6′′–7′′ where the steep V − I and R − I color drop-off occurs is identifiable with the radius where the line-of-sight contribution of stellar emission steeply decreases from a plateau value of ~ 40% for 3 ≲ R⋆ ≲ 6′′ to less than 20%. Therefore, the much deeper data studied here confirm and strengthen the previous conclusion that the extended (6′′ ≲ R⋆ ≲ 20′′) exponential LSB envelope of I Zw 18 is due to ne.
The gaseous nature of the LSB envelope of I Zw 18 is also evident from the color maps in Figs. 6 and 7. These show a clear correspondence to radial color profiles, most notably a strong core-envelope color contrast (0.5–1.5 mag) and remarkably uniform colors for the envelope (V − R ~ 0.5 ...0.6, R − I ≈ − 1.4 mag, V − I ≈ − 1 mag) on a spatial scale of 9 kpc2. Though prominent on direct images (cf. Fig. 1), the northwestern supershell, for example, is barely distinguishable from its gaseous surroundings on V − I and R − I color maps, suggesting a nearly constant spectral energy distribution (SED) over the full LSB envelope.
The relative extent of the stellar component that is confined to the compact HSB core with respect to the nebular LSB envelope is illustrated better in Fig. 8. The image reveals a complex network of ionized gas filaments extending as far out as 2.6 kpc, twice the galactocentric distance previously reported from HST WFPC2 studies and equivalent to ~16 exponential scale lengths α of the stellar host of I Zw 18 (160 pc; P02). The contours, adapted from P02, are computed from HST WFPC2 R data, after 2D subtraction of Hα line emission (referred to as R′), they thus delineate the morphology of the stellar and nebular continuum emission. I Zw 18 (i.e. its stellar component as depicted by the R′ contours) and I Zw 18 C show remarkably similar structures.
 |
Fig. 9 Three-color image of I Zw 18 displaying the unresolved stellar emission (Id) in the red channel and the R and V emission of compact ne-dominated regions in the green and blue channels. White areas in the central (red) part of the galaxy depict regions whose colors are strongly affected by nebular emission, as is apparent from their extremely blue V − I and R − I (<–0.4 ...–0.8) colors. The inset, showing a magnified portion of the western supershell, is meant to illustrate a subtle spatial shift between the Vc and Rc emission. This can be attributed to a spatial displacement by 30–100 pc between the intensity maxima of the [Oiii]λλ4959, 5007 and Hα emission lines. |
3.2.1. The impact of nebular emission on the colors of the stellar component of I Zw 18
We discuss next the effect of ne contamination in the HSB core in more detail, i.e. the region subtended by the 25 R′ mag/◻″ isophote in Fig. 8. Our color maps reveal here a substantial substructure that was not sufficiently recovered from previous data. A previously known feature is the ne rim (EW(Hα) = 1500–2000 Å; Östlin et al. 1996; Vílchez & Iglesias-Páramo 1998; Papaderos et al. 2001; Izotov et al. 2001a) that encompasses the SF region NW. Its V − I and R − I colors are much bluer (–0.8 mag and –0.6 mag, respectively) than those of the centrally located young SCs (–0.15 mag and –0.23 mag, measured within a 28 × 28 aperture) where the EW(Hα) is much lower (~200 Å; Izotov et al. 2001a).
This striking spatial anticorrelation between stellar surface density and emission-line EWs, with the V − I color steeply decreasing with the increasing EW in the periphery of ionizing SCs is essentially identical to what is described in the XBCD SBS 0335-052E by P98: the bluest V − I colors (–0.8 mag) in that galaxy were not observed at the position of its young SCs but in their periphery, over an extended horseshoe-shaped gaseous rim some 500 pc offset from the former. Several similar examples are documented among XBCDs and BCDs (e.g. Papaderos et al. 1999; Guseva et al. 2001; Fricke et al. 2001; Östlin et al. 2003; Guseva et al. 2004; Papaderos et al. 2008) both on small and large spatial scales.
Of considerable interest is also the small-scale contamination of colors in the HSB core of I Zw 18 due to ne. To better illustrate its impact, we computed a pseudo three-color composite (Fig. 9) using a combination of unsharp masked images (see discussion in Sect. 3.1). To partly suppress the stellar contribution in Vc and Rc images (blue and green channels, respectively), we subtracted from the latter a pseudo stellar continuum using a scaled version of the Ic image. This procedure allowed us to better isolate and visualize regions where ne contamination is strongest. The red channel in Fig. 9 holds the unresolved emission in the I band (Id) and thus primarily reflects the stellar host galaxy. In the resulting three-color overlay, white patches on top of the reddish background of the HSB core depict regions where ne dictates colors. Just like in radial profiles and color maps (Figs. 5–7), the footprint of ne is a combination of red V − R with extremely blue V − I and R − I colors. Some examples include the regions labeled 1 through 8, whose respective colors are (0.1, –0.35, –0.45), (0.17, –0.58, –0.76), (0.05, –0.41, –0.45), (0.23, –0.43, –0.67), (0.24, –0.45, –0.69), (0.21, –0.53, –0.74), (0.12, –0.35, –0.47), and (0.23, –0.23, –0.46). The total area of these severely ne-contaminated regions of ≈ 30 ◻″ is equivalent to the isophotal size of I Zw 18 at 22 mag/◻″ (32 ◻″) and to 20% of that of its stellar component (the region subtended by the 25 R′ mag/◻″ isophote in Fig. 8).
 |
Fig. 10 Schematic illustration of the effect that the slight spatial displacement between the [Oiii]λλ4959, 5007 and the Hα emission lines across an expanding shell of ionized gas might have on the V and R photometry of stars in its close vicinity. The shell, of thickness 100 pc ( ≈ 1′′at the distance to I Zw 18), comprises an inner and outer zone with, respectively, higher and lower [Oiii]/Hα ratios (cf. the discussion related to Figs. 6 and 9). |
It is noteworthy that ne shows significant substructure on spatial scales of a few pixels, with little spatial correlation to the local stellar background. Therefore, its treatment and subtraction as a uniform foreground emitting layer in CMD studies could result in systematic uncertainties that might not be fully accounted for by the standard error budget. Subtle spatial displacements between the intensity maxima of strong nebular emission lines may be relevant in this regard. An example is given in the inset of Fig. 9 where we show magnified a portion of the western supershell. It can be seen that the inner layer along the shell appears blueish whereas the outer one greenish. This can be plausibly attributed to a displacement by 01–03 between the [Oiii]λλ4959, 5007 and Hα emission lines, which are registered in V (blue channel) and R (green channel), respectively. Another illustrative example is given for a shell ~5′′ northwards of region NW (Fig. 6) whose inner (southeastern) and outer (northwestern) layer differ by ≈ 0.3 mag in their V − R color, pointing to a variation by ≳30% in the [Oiii]/Hα ratio across the shell. Systematic variations of the [O iii]λ5007/Hβ ratio by a factor ~3 on spatial scales of a few ten pc have been documented by integral field unit spectroscopy in a number of Hii regions and BCDs (see e.g. Westmoquette et al. 2007; Cairós et al. 2009; Relano et al. 2010; Monreal et al. 2010).
Whereas spatial displacements between nebular lines certainly have no measurable effect on CMD studies of galaxies with faint ne, they may be important in the case of I Zw 18. This is because the local background level in point source photometry studies may be overestimated by a different amount in different bands, depending on the position of a star relative to a shell and the specifics of the local background determination. Figure 10 illustrates two special cases schematically: for a star located near the inner interface of the shell (case a), the circular annulus within which the local background is determined captures the inner [Oiii]-enhanced portion of the shell and misses its outer Hα-enhanced layer. This could lead to an over-subtraction of the local V background, hence to a reddening of the V − R color. The opposite might be the case for a star close to the outer boundary of the shell (case b), whose color would appear bluer due to the overestimation of the R (Hα enhanced) background. In the simple geometry of Fig. 10, the principal effect would then be a redder color for stars in the shell interior and vice versa, in addition to underestimated stellar magnitudes because of over-subtraction of the local background. An examination of the cumulative effect that multiple overlapping ne shells could have on CMD studies of I Zw 18 might therefore be of some interest.
Of special relevance to the study of the evolutionary status of I Zw 18 (Sect. 4.2) are the colors of region ω (Fig. 1). This region, roughly delimited by the rectangular area at (RA, Dec) = (58 ...46, –66 ...–44) relative to NW (see Figs. 6 and 7) is relatively free of ne contamination (cf. the EW(Hα) map in Fig. 7 of Izotov et al. 2001a), its colors can therefore be used to place constraints on the age of I Zw 18. From the present data we infer a mean V − R color of –0.06 mag and a R − I and V − I color of ≈ 0.2 mag with values of V − R ≃ R − I ≈ 0.15 mag and V − I = 0.3 mag within its reddest quarter. The V − I color range inferred for region ω from HST ACS data is in good agreement with the values 0.17–0.32 mag previously determined by P02.
4. Discussion
4.1. Constraints on the evolutionary status of I Zw 18 C
In Fig. 11 we compare the observed colors of I Zw 18 C with the predicted color evolution for a stellar population forming instantaneously (SFH1), with an exponentially decreasing star formation rate (SFR) and an e-folding time τ = 1 Gyr (SFH2) and continuously with a constant SFR (SFH3). The theoretical curves were computed with the evolutionary synthesis code Pegase 2.0 (Fioc & Rocca-Volmerange 1997) for constant stellar metallicity of Z = 0.001 and Salpeter initial mass function (IMF) between 0.1 and 100 M⊙, and do not include nebular emission.
As already pointed out in Sect. 3.1, the blue and nearly constant (0 ± 0.05 mag) V − I and R − I colors of I Zw 18 C down to 27.6 mag/◻″ imply that the photometrically dominant stellar population in this system is almost uniformly young. Formal upper age estimates within 1σ uncertainties range from t1 = 15 Myr for SFH1 to t2 ~ 35 Myr for SFH2,3. The last two SF scenarios are, however, incompatible with the data since star formation starting at t2 and continuing to the present would have given rise to ample ne with an EW(Hα) ≳ 800 Å. The uniformly blue colors of I Zw 18 C, in connection with the absence of ne everywhere but in its central region indicate that SF activities must have ceased very recently, some ~20 Myr ( = tc) ago. If so, the estimated SF duration (t2 − tc ≃ t1) would imply an almost instantaneous SF process, rapidly synchronized over the projected area of the galaxy (~1 kpc2) probably at supersonic speeds.
A conceivable scenario might invoke sequential star formation from the redder northwestern tip towards the bluer southeastern tip of I Zw 18 C (see also Aloisi et al. 1999; Izotov et al. 2001a). The respective colors of those regions translate by SFH1 to an age difference of τSF = 40 − 80 Myr. Taking τSF ~ 60 Myr as an indicative timescale for the spatial progression of SF activities along the projected major axis of I Zw 18 C (1 kpc), one can estimate an average SF propagation velocity of uSF ~ 20 km s-1. This is comparable to the uSF inferred for the XBCD SBS 0335-052E (~20–35 km s-1, P98, Reines et al. 2008), close to the sound speed in the warm ISM. Induced gas collapse along the collisional interface of a supershell expanding from the northwestern tip of I Zw 18 C between 80 Myr (τSF + tc) and tc ago might offer a tenable, though not necessarily unique, explanation for propagating star formation. Following McCray & Kafatos (1987), the radius Rsh (pc) of a SF-driven supershell can be approximated as  (3)where Lm,38 is the mechanical luminosity injected into the ISM by stellar winds and SNe in 1038 erg s-1, n0 the ambient gas density in cm-3 and t7 the dynamical expansion time in 107 yr. A rough estimate of the mean mechanical luminosity can be inferred from the absolute V magnitude of I Zw 18 C (–12.2 mag), which for continuous star formation over τSF and an ensuing quiescent phase over the past tc translates into a stellar mass of ≈ 2.1 × 10⁵ M⊙ and a mean SFR of 3.5 × 10⁻³ M⊙ yr-1. The mean Lm,38 over τSF may be estimated from Starburst99 (Leitherer et al. 1999) to be 14.6.
 |
Fig. 11 Comparison of the V − I and R − I colors of I Zw 18 C and of region ω in I Zw 18 with model predictions for a stellar population forming instantaneously (SFH1: thick dotted curve) or continuously, with an exponentially decreasing or constant star formation rate (SFH2 and SFH3: thick solid and dashed lines, respectively). The models have been computed with Pegase 2.0 (Fioc & Rocca-Volmerange 1997) for a constant metallicity (Z = 0.001) and a Salpeter initial mass function between 0.1 and 100 M⊙, and do not include nebular emission. Thin curves correspond to the same star formation histories but assume an IMF truncated above 5 M⊙. The vertical bars labeled I Zw 18ω depict the range between the mean and reddest color in region ω of I Zw 18 (V − I = 0.2 ...0.3 and R − I = –0.06 ...0.15). Bars labeled I Zw 18 C (1′′–6′′) indicate the mean color of I Zw 18 C in the radius range 1′′ ≤ R⋆ ≤ 6′′ ( ≈ 0 ± 0.05 mag). The mean colors and their 1σ uncertainties in the extreme periphery (R⋆ ≥ 6′′) of I Zw 18 C at μ ≳ 27.6 mag/◻″ are depicted by the rectangular areas. |
Equation (3) then yields an ambient gas density n0 ≈ 4 cm-3 for Rsh = 1 kpc and t7 = 6 ( ≡ τSF). This value does not seem to be unrealistic, given that the VLA HI map by van Zee et al. (1998) indicates an Hi surface density of ≳ 4 × 1020 cm-2 for I Zw 18 C, which after including the helium contribution translates to n0 ~ 3 cm-3 for a disk thickness of ~50 pc. Because the passage of the SF front along I Zw 18 C has probably been accompanied by the depletion of its molecular content and the dispersal of its ISM, the present gas surface density should, in fact, represent a lower estimate for the average n0 over τSF. Clearly, the considerations above rely on strongly simplifying assumptions (constant Lm,38 and n0, no radiative losses in the shell, coplanar face-on geometry) and are only meant to be indicative. They merely touch upon one among several possible scenarios behind propagating star formation in I Zw 18 C (e.g., gravitational interaction with the main body or gas infall from the Hi halo) and are invoked to demonstrate that this process can account for some important characteristics of the galaxy. These include its uniformly blue colors with merely a weak color gradient along its major axis, the virtual absence of ne, and the higher surface density of the unresolved stellar background in its northwestern half as a possible signature of the disintegration of its oldest SCs. However, propagating star formation between τSF + tc and tc cannot alone explain the slightly redder color of stellar populations on the outskirts of I Zw 18 C.
4.1.1. Stellar diffusion and its effect on age determinations in the faint periphery of I Zw 18 C
In the following we explore the evolutionary history of I Zw 18 C further by considering the properties of its faint (27.6–29 mag/◻″) stellar periphery. The (V − I)d (0.2 ± 0.08) and R − I (0.16 ± 0.09) color of the latter translate by SFH2 to an age of ~130 Myr with an upper bound of ~500 Myr at the 1σ level, if purely stellar emission is assumed. For models including ne, age estimates would rise to 270–900 Myr, depending on the color considered. However, even for those high ages, this SFH model (and SFH3 alike) predicts an EW(Hα) between 150 Å and ≳ 300 Å, in clear conflict with the absence of ne in the outskirts of I Zw 18 C. Models invoking continuous star formation to the present are thus fundamentally incompatible with the data. Cessation of SF activities over the past tc would alleviate the contradiction; however, it would at the same time imply a steeper color evolution, thus a younger age, in better agreement with the 1σ upper estimate tSFH1 ~ 100 Myr read off Fig. 11 for the instantaneous star formation model.
As we argue next, stellar diffusion and the resulting radial stellar mass filtering effect described by P02 could have a significant effect on the color distribution of young galaxy candidates and add an important element towards a consistent evolutionary picture for I Zw 18 C. Already at a mean radial velocity of ur ≲ 4 km s-1, less than the velocity dispersion of the neutral gas (σHI ≈ 6–8 km s-1), a star born in the central part of I Zw 18 C could migrate within τdiff = τSF + tc (80 Myr) out to rdiff ≈ 300 pc from its initial locus. This galactocentric distance corresponds to the semi-minor axis of I Zw 18 C at 29 mag/◻″; i.e., it is topologically identifiable with the redder, outer exponential SBP feature in Fig. 3. A consequence of stellar diffusion with the above radial velocity is that any stellar generation reaching out to rdiff cannot be bluer than 0.3 mag in V − I (approximately the 1σ color bound, depicted by the rectangular area in the upper panel of Fig. 11), since on its way to that radius it will have been depopulated from stars with lifetimes ≤ τdiff (or, correspondingly, from stars more massive than Mdiff). The commonly adopted SFH2,3 models would then inevitably result in an overestimation of the stellar age in the LSB periphery (R⋆ ≃ rdiff) of young galaxy candidates, such as I Zw 18 C. This is because such SFH parametrizations are applied throughout on the implicit assumption that stellar populations form in the radial zone where they are currently observed, so they invariably contain a certain fraction of massive blue stars younger than τdiff. Obviously, a match between predicted and observed colors is then only possible for an age tSFH2,3 exceeding the true stellar age t ⋆ at the radius R⋆; i.e., the condition  (4)applies throughout, in particular when models including ne are adopted.
That, in the presence of stellar diffusion, the age of the LSB host of young BCD candidates may be overestimated when continuous star formation models are used is especially apparent when projection effects are additionally taken into account: in a spherical-symmetric geometry, the colors registered at R⋆ ≡ rdiff reflect the luminosity-weighted average of stars at radii ≥ rdiff, since the observer’s line of sight crosses more remote foreground and background galaxy zones of longer τdiff. Therefore, even though SFH2,3 may provide a reasonable approximation to the integral SFH of some SF dwarf galaxies (SFDGs), it should not be taken for granted that they are universally applicable to spatially resolved age-dating studies. This is already suggested by the failure of, e.g., SFH3 to reproduce the generally red colors (V − I = 0.9, B − R = 1.1) of the host galaxy of typical BCDs (see e.g. P02), even for ages exceeding the Hubble time.
The effect of stellar diffusion to the radius rdiff is equivalent to in situ star formation at rdiff with an IMF that is truncated at masses above a radially decreasing limit Mdiff(τdiff) (hereafter tIMF). To illustrate this point, and as a minimum consistency check, one may consider continuous star formation according to SFH2,3 with a tIMF limited to stars with a lifetime ≳ τdiff. This timescale roughly corresponds to the main sequence lifetime of a B4 star (94 Myr), placing an upper cutoff of 5 M⊙ to the tIMF. The color evolution for SFH2,3 with that tIMF is depicted in Fig. 11. It can be seen that SFH2,3+tIMF models reproduce the observed colors at an age of ~130 Myr with an 1σ upper bound of 150–250 Myr and consistently account for the absence of nebular emission.
A conceivable alternative to stellar diffusion is in situ star formation in the LSB periphery of I Zw 18 C in conjunction with stochastic effects on the IMF (see Cerviño & Mas-Hesse 1994, and references therein). The latter are to be expected when low masses are involved in the SF process, as is typically the case for SFDGs, and to affect the sampling of the IMF in its intermediate-to-high mass range. Cerviño & Mas-Hesse (see their Fig. 1) argue, however, that stochastic effects do not result in a truncated IMF above a certain stellar mass, but some massive stars always form. On the statistical average, one would therefore expect nebular emission to be present in the outskirts of I Zw 18 C, in disagreement with the observations. It should be noted, though, that this conclusion very likely depends on the detailed physics of star formation, from which the high-mass end of the IMF is populated and the timescales for low- and high-mass star formation. With certain assumptions (see e.g. Weidner & Kroupa 2005; Pflamm-Altenburg et al. 2009), a truncated IMF can be realized in peripheral galaxy zones, lifting the discrepancy described above. There might therefore be variants of the traditional static scenarios, i.e. scenarios implicitly assuming that stars are born in the radial zone where they are observed, which can quantitatively reproduce the radial color distribution of I Zw 18 C and SFDGs in general. It is not clear, however, whether such static scenarios, and their assumptions on the radial dependence of the IMF, can consistently account for the specific structural characteristics of SFDGs, and in particular BCDs, such as the exponentiality of the stellar LSB host and the confinement of SF activities to within R⋆ ≈ 2α (see e.g. P96b).
Stellar diffusion and its role in the buildup of SFDGs constitutes an unexplored territory in dwarf galaxy research. A caveat of the above discussion is that it assumes young stars to initially drift apart freely at a roughly constant velocity ur ( ≲ σHI) over ~108 yr. Clearly, the validity of this simplifying assumption needs to be investigated, and the initial kinematics of the newly formed stars, as well as the form of the gravitational potential should be included in the analysis. High-velocity resolution (≲10 km s-1), integral field spectroscopy might provide key insights into the velocity patterns and the possible outwards migration of bound and unbound stellar clusters in young starbursts. A closer investigation of the effects of diffusion would be of considerable interest, among others, because it offers a mechanism that naturally produces radial color gradients in galaxies, which might be relevant to e.g. the Red Halo phenomenon (Bergvall & Östlin 2002; Zackrisson et al. 2006; Bergvall et al. 2010).
In summary, our results suggest that the overall photometric properties of I Zw 18 C can be consistently accounted for by a single episode involving solely sequential star formation (uSF ≈ 20 km s-1) and stellar diffusion (ur ≈ 4 km s-1) over the past ~100–200 Myr. Whereas an ultra-faint substrate of ancient stars cannot be ruled out per se, the lines of evidence presented here indicate that I Zw 18 C is a cosmologically young object. This conclusion concurs with the one of Izotov et al. (2001a) who infer an upper age of ~100 Myr for I Zw 18 C from spectral synthesis models. Jamet et al. (2010) reach a similar conclusion, that I Zw 18 C is younger than ≈ 125 Myr, from a probabilistic analysis of HST ACS CMDs.
4.2. Constraints on the evolutionary status of I Zw 18
We turn next to the evolutionary status of I Zw 18’s main body. The V − I and R − I color range in region ω (Fig. 11), translate by SFH2,3 to an age between ~100 and ≲ 250 Myr. The possibility of I Zw 18 and I Zw 18 C forming a co-evolving pair of dwarf galaxies that underwent a roughly synchronous strong recent evolution can not be ruled out.
By considering the reddest quartile of region ω, one obtains from SFH2,3 an upper age of ~500 Myr. The age span inferred from the present study is consistent with that obtained from the mean B′ – V′ (0.09 ± 0.04 mag) and V′ – R′ (0.12 ± 0.04 mag) for the stellar host galaxy of I Zw 18 after 2D subtraction of strong nebular lines from broad band images (P02). However, the latter emission-line free colors are likely to be slightly overestimated, since they do not include corrections for the red (B − V = 0.34, V − R = 0.64, see e.g. Krüger et al. 1995) nebular continuum. Notwithstanding this fact, even when taken within their +1σ bounds at face value, they imply by SFH2 an age of ~0.8 Gyr, translating into a mass fraction of ≳ 50% for stars younger than 0.5 Gyr. Evidently, this conclusion (see also Hunt et al. 2003) does not conflict with the presence of a small number ( ≲ 20) of stars with ages between 0.5 and ~ 1 Gyr in CMDs (Aloisi et al. 1999; Östlin 2000; Östlin & Mouhcine 2005). On the other hand, it is important to bear in mind that estimates of the mass fraction of young stars critically depend on the adopted SFH.
4.2.1. An extended underlying stellar disk in I Zw 18?
We next revisit the hypothesis envisaged by Legrand (2000), according to which the formation of I Zw 18 occurs throughout its Hi halo (60′′ × 45′′) at an extremely low SFR over the past ~14 Gyr. This model can reconcile the low gas-phase metallicity of I Zw 18 with a cosmological age, and predicts a high degree of chemical homogeneity in its warm ISM. From the photometric point of view, the main prediction from the Legrand model is an extended ultra-LSB underlying stellar disk (V mag/◻″). In a subsequent study, Legrand et al. (2001) generalize the scenario of “slowly cooking” dwarfs to BCDs, arguing that their main metallicity and stellar mass contributor is continuous star formation, rather than coeval starbursts.
The hypothesis of a stellar disk beneath the nebular envelope of I Zw 18 was investigated later on by P02 on the basis of emission-line free HST WFPC2 B′, V′, and R′ images. By consideration of photometric uncertainties, P02 argue that the predicted disk would evade detection on their SBPs if its central surface brightness μE,0 is fainter than 27.1 mag/◻″ and its exponential scale length α is larger than 105. These limits translate to an apparent magnitude of 20 mag and a  mag/◻″, slightly fainter, but probably still consistent within the uncertainties, with the
  predicted by the Legrand model. Thus, previous surface photometry could neither strictly rule out nor establish the presence of the putative ultra-LSB disk in I Zw 18. Since deep HST ACS narrow-band imagery is unavailable for I Zw 18, we cannot improve on the nebular line subtraction carried out by P02 and push previous V′and R′ surface photometry to fainter levels.
However, CMD studies of I Zw 18 argue against the disk hypothesis, as none among them has revealed a uniform and extended population of RGB stars being cospatial with the nebular envelope, in sharp contrast to any evolved BCD studied as yet. Admittedly, because none among the published CMD studies for I Zw 18 fully appreciates the importance of ne contamination (except for that by IT04) and attempts a proper assessment of the systematic errors this can introduce, the robustness of the nondetection of RGB candidates in the LSB envelope cannot be evaluated currently, and it is not clear whether CMD studies can ever place firm constraints in this respect. The currently most convincing evidence for the absence of a substantial stellar background beneath the nebular envelope of I Zw 18 is based on the emission-line free HST images by P02 (see their discussion). Even if an ultra-LSB stellar disk complying with the photometric limits placed by P02 was present, it would probably not significantly alter the interpretation of youth for I Zw 18: for continuous SFR over 14 Gyr, the absolute V magnitude of the predicted disk (–11.4 mag) translates into a stellar mass of ~5.6 × 10⁶ M⊙. The V′ magnitude of the host galaxy of I Zw 18 (i.e. excluding regions NW and SE) of –13.8 mag (P02) translates by SFH2 for an age between 0.5 and 1 Gyr to a stellar mass of ~11 × 106 M⊙, i.e. about twice that of the hypothetical ultra-LSB disk. Even in the extreme case of a 14 Gyr old instantaneous burst, the underlying disk would only be twice as heavy as the young population that has formed on a much shorter timescale. Consequently, the conclusion that I Zw 18 has formed most of its stellar mass at a late cosmic epoch still holds. It would be interesting to check whether the combined chemical output from these two stellar populations is consistent with the observed gas-phase metallicity in I Zw 18.
With regard to the proposed generalization of the “slowly cooking” scenario, it should be noted that the Legrand model faces difficulties in reproducing basic photometric properties of BCDs. Specifically, the host galaxy of typical BCDs is incompatible with an ultra-LSB disk and, on the contrary, its central stellar density ( ≥ 1 M⊙ pc-3) exceeds by an order of magnitude that of dwarf irregulars or dwarf spheroidals (P96b). Similarly, the mean surface brightness of the BCD host is ≤ 24 B mag/◻″ (e.g. P96b, Amorín et al. 2009), roughly 4 mag brighter than the model prediction. Additionally, as pointed out in Sect. 4.1.1, continuous star formation models are inconsistent with the red host galaxy colors of most nearby BCDs. In summary, although appealing from the chemical point of view, the “slowly cooking” scenario does not seem to be reconcilable with the structural properties of BCDs. This scenario might, however, provide a good approximation of quiescent late-type dwarfs, such as blue low surface-brightness galaxies (Rönnback & Bergvall 1994).
4.3. I Zw 18 as local morphological template for rapidly assembling galaxies at high redshift
The integral photometric properties of the overwhelming majority of SF galaxies in the local universe are barely affected by ne. Typically, the EW(Hα+[N ii]) ranges between a few ten Å (e.g. Moustakas & Kennicutt 2006; Koopmann & Kenney 2006) in normal late-type galaxies to ≲ 102 Å for the majority of local SFDGs (see e.g. Lee et al. 2007; Sánchez Almeida et al. 2008). Even for BCDs, ne has a noticeable photometric impact (EW(Hα+[N ii]) ≃ 200–500 Å; Terlevich et al. 1991; Cairós et al. 2002; Bergvall & Östlin 2002; Gil de Paz et al. 2003; Guseva et al. 2009, among others) in their centrally confined SF component only (i.e. for R⋆ ≲ RSF, with RSF on the order of ~1 kpc) and is practically negligible for larger radii where the evolved stellar LSB host entirely dominates the line-of-sight intensity (P02, Knollmann 2004). More generally, even though ne in local SFDGs may protrude beyond RSF (Hunter & Gallagher 1985; Gallagher et al. 1989; Hunter & Gallagher 1990, 1992; Meurer et al. 1992; Marlowe et al. 1995; Ferguson et al. 1996; Papaderos & Fricke 1998; Martin 1998; Bomans 2002; Cairós et al. 2002, among others), its extremely low surface brightness means it has no impact on surface photometry (P02, Knollmann 2004). As an example, even for BCDs with strong ongoing SF activity, corrections of integral photometric quantities for ne do not exceed ≈ 0.1 mag (Salzer et al. 1989).
 |
Fig. 12 Schematic comparison of typical blue compact dwarf (BCD) galaxies (left) with I Zw 18 (right) with respect to the morphology and radial intensity distribution (upper and lower figures, respectively) of their stellar and nebular emission. |
In the nearby universe, the only cases of SFDGs with extreme ne contamination are documented in a few XBCDs. Intense and almost galaxy-wide SF activity in these rare young galaxy candidates, in combination with the low surface density of their underlying stellar host, boost [Oiii]λ5007 and Hα emission line EWs to values of up to ≳ 2 × 10³ Å and ≳ 1.6 × 10³ Å, respectively (e.g. P98, Izotov et al. 1997a; Guseva et al. 2004; Izotov et al. 2006; Papaderos et al. 2006b, 2008, among others), i.e. close to the effective width of broad band filters. Similar, though less extreme, cases are some of the recently discovered ultra-compact starbursting dwarfs in galaxy clusters (EW(Hα) ~ 103 Å, Reverte et al. 2007).
As shown in P02, the radial Hα intensity profiles of BCDs comprise two characteristic components: an HSB core with R⋆ ≃ RSF and an outer, roughly exponential LSB envelope with αHα in the range 0.1–1 kpc. Judging from its αHα (210–270 pc) and radial extent (R⋆ ~ 2.6 kpc), the ne halo of I Zw 18 is by no means exceptional among BCDs/SFDGs. However, I Zw 18 strikingly differs from any SFDG studied as yet because the galaxy itself (i.e. its stellar host, cf. Fig. 8) is several times more compact than the nebular halo: ne dominates already for R⋆ ≃ 6′′ ( ≡ 3 Reff) and reaches as far out as ~16 stellar exponential scale lengths (Sect. 3.2). This so far unique case in the nearby universe is schematically illustrated in Fig. 12 where the radial distribution of stars and ne in I Zw 18 is compared with that of normal BCDs.
For the forthcoming discussion, it is specially important to recall that the surface brightness level at which in I Zw 18 ne dominates is quite high (μ ≃ 23.5 mag/◻″; cf. Fig. 5), i.e. comparable to the central surface brightness of dwarf irregulars (e.g. Patterson & Thuan 1996; van Zee 2000) and dwarf ellipticals (Binggeli & Cameron 1991, 1993), and by at least one mag brighter than that of Local Group dwarf spheroidals (cf. Mateo 1998). The ne envelope of I Zw 18 is therefore not to be confused with the extraordinarily diffuse ne in typical SFDGs. Also relevant is that the exponential ne envelope contributes at least one third of the total R band luminosity of I Zw 18 (P02 and Sect. 3.2).
As we argue next, the morphological properties of I Zw 18, whereas unique among nearby SFDGs, are probably typical of rapidly assembling galaxies in the distant universe. Just like I Zw 18, these systems are building up their stellar component through starbursts or prolonged phases of strongly elevated specific SFR (SSFR), translating into short (a few 100 Myr) stellar mass doubling times. The cumulative output of energy and momentum from stellar winds and SNe during such dominant phases of galaxy evolution will inevitably lead to large-scale gas thermalization and acceleration, with supershells protruding much beyond the galaxy itself. Extended nebular halos encompassing the still compact stellar component of high-SSFR proto-galactic systems may thus be ubiquitous in the early universe. The photometric structure of these galaxies could then closely resemble the right-hand panel of Fig. 12, comprising an HSB core within which the stellar component is confined and dominates and a much larger, nearly exponential, nebular LSB envelope. Despite cosmological dimming, the latter should be readily accessible to observations out to z ≳ 2, given that deep HST imaging and image stacking now permit studies of galaxies down to rest-frame surface brightnesses of ≳ 26.5–28.5 mag/◻″ at those redshifts (e.g. Stockton et al. 2008; van Dokkum et al. 2010; Noeske et al. 2006). Morphological analogs to I Zw 18 may also exist among compact high-SSFR galaxies at intermediate redshift (0.1 ≲ z ≲ 0.8), such as compact narrow emission-line galaxies (Koo et al. 1994; Guzmán et al. 1998), luminous compact blue galaxies (Guzmán et al. 2003; Puech et al. 2006) and green pea (GP) galaxies (Cardamone et al. 2009; Amorín et al. 2010; Izotov et al. 2011). The rest-frame EWs of GPs can in some cases almost compete with those of nearby XBCDs (see e.g., Izotov et al. 2001b; Papaderos et al. 2006b).
Such considerations motivate a closer examination of observational biases that the spatial segregation between stellar and nebular emission may introduce into studies of distant, poorly resolved morphological analogs of I Zw 18. By appreciation of the differing spatial distribution of stellar and nebular emission, the discussion here goes beyond the framework of the state-of-art modeling studies that explore the impact of ne on the integral SED of SF galaxies in detail (e.g. Huchra 1977; Bergvall 1985; Salzer et al. 1989; Olofsson 1989; Krüger et al. 1995; Fioc & Rocca-Volmerange 1997; Izotov et al. 1997a; Guseva et al. 2001; Moy et al. 2001; Anders et al. 2004; Zackrisson et al. 2001; Panuzzo et al. 2003; Zackrisson et al. 2008; Kotulla et al. 2009; Martín-Manjón et al. 2010; Schaerer & de Barros 2009; Finlator et al. 2011; Ono et al. 2010, among others). The predictions from such zero-dimensional models are to be treated with some caution when compared with spatially resolved observables (e.g. radial EW and color profiles) in order to place constraints on the formation history of galaxies. The minimum prerequisite for this approach to be valid is that nebular emission is cospatial with the local ionizing and non-ionizing stellar background, or, equivalently, that the ionizing Lyman continuum budget is reprocessed into nebular emission on the spot. That this idealized picture is not invariably valid and, actually, a strong spatial anticorrelation between emission line EWs and stellar surface density may evolve over time both on small and large scales has been shown for several XBCDs (e.g. P98; P02; Papaderos et al. 1999; Izotov et al. 2001a; Guseva et al. 2001; Fricke et al. 2001). In these cases, subtracting synthetic ne SEDs from observed spectra, as done in P98, offers the only viable approach for isolating and age-dating the underlying stellar SED.
 |
Fig. 13 Upper panel: comparison of the R SBP of I Zw 18 (filled circles), with a synthetic SBP (labeled core+env1) that is due to the superposition of two exponential components of differing central surface brightness μ0 and exponential scale length α. The first one, labeled core (open circles) approximates the stellar component that is confined to and dominates within the inner (R⋆ ≤ 6′′) HSB part of the observed SBP. The second component (env1; dotted line intersecting the abscisca at μ ~ 22 mag/◻″) is a linear fit to the nebular LSB envelope. A Sérsic model to the composite core+env1 SBP (orange solid-line curve) yields a Sérsic exponent η ≈ 2, close to the best-fitting value of η ≈ 2.2 for the observed SBP. The synthetic SBP labeled core+env2 (red solid-line curve) is computed by superposing on the core an exponential nebular envelope of equal luminosity but twice as large α as the observed envelope env1. A Sérsic fit to core+env2 (thin curve) yields an η ≈ 5. Lower panel: residuals between the synthetic SBPs core+env1 (thin curve) and core+env2 (thick curve) and their Sérsic fits when the latter are computed down to a surface brightness level μlim of 26.5 and 29 mag/◻″ (solid and dotted curves, respectively). |
A discussion of aperture effects on the luminosity-weighted SEDs of distant morphological analogs to I Zw 18 is beyond the scope of this study. Here, we only focus on potential photometric biases. A first one, already described in P02, arises from the fact that the nebular envelope may be taken as evidence for an evolved stellar disk, because of its exponentiality and reddish (B − R and V − R) rest frame colors. Automated surface photometry analyses of large extragalactic probes, if not including a robust discriminating criterion between stellar and nebular emission, could therefore be biased towards an enhanced frequency of galactic disks already in place at an early cosmic epoch. The arguably most convincing argument for this concern derives from I Zw 18 itself: if for one of the best studied galaxies in the local universe, it took three decades to realize that its exponential LSB luminosity envelope is not due to a stellar disk, but to ne, one may rightfully doubt that this would be immediately apparent in studies of its poorly resolved morphological analogs at high z.
 |
Fig. 14 Best-fitting Sérsic exponent η vs. μlim for the SBPs in Fig. 13. The thick-gray curve and the filled squares show, respectively, the variation in η for the observed R band SBP of I Zw 18 and the two-component approximation to it, labeled core+env1. The variation in η with μeff for the synthetic SBP core+env2 is shown with filled circles. |
Another potential bias comes from the fact that the superposition of two exponential profiles of differing μ0 and α – one representing the steeper star-dominated core and the other the shallower nebular envelope – can closely approximate a genuine Sérsic profile with a high shape parameter (2 ≤ η ≲ 5), thereby mimicking the SBP of a massive spheroid. The best-fitting Sérsic exponent η for such a composite SBP depends both on the properties of its constituent exponential profiles and on the limiting surface brightness μlim down to which Sérsic models are fitted. As an example, the best-fitting η for I Zw 18 increases monotonically from 1.1 for μlim = 23.5 mag/◻″ (at the surface brightness where ne takes over) to 2.2 for μlim = 28 mag/◻″. This is illustrated in Fig. 13, where the observed SBP of I Zw 18 is compared with the superposition of two exponential components, approximating the core (profile labeled core) and the ne envelope (profile labeled env1). Their sum (core+env1) is then fitted by Sérsic models down to a progressively faint μlim. It can be seen from Fig. 14 that the best-fitting η for the synthetic SBP is doubled when μlim decreases from 23.5 to ≥ 27.5. The same trend is recovered when Sérsic models are fitted directly to the observed SBP.
It is worth checking how the Sérsic η vs. μeff relation may change in the case of an equally luminous but shallower nebular envelope. For this, we superpose on the core a component (env2) whose μ0 and α are by, respectively, 1.5 mag fainter and a factor of 2 larger than that in the observed component env1. The Sérsic fit to the core+env2 profile is included in Fig. 13. As is apparent in Fig. 14, in this case η shows a steeper dependence on μlim, increasing to ~4 already for μlim ≃ 26.5 mag/◻″ and leveling off to ~5 at fainter levels.
Consequently, Sérsic fits can easily lead to the misclassification of a compact high-SSFR galaxy as a massive elliptical and, quite counter-intuitively, deeper photometry exacerbates the problem. The residuals between SBP and model (lower panel of Fig. 13) are ≲ 0.5 mag for core+env2 and just ≲ 0.2 mag for core+env1, i.e. on the order of 1σ uncertainties in SBPs of intermediate-to-high z galaxies (cf. e.g. Noeske et al. 2006), i.e. small enough to go undetected. In practice, even when PSF convolution effects are fully accounted for, the pseudo-Sérsic profile of a compact diskless high-SSFR galaxy is barely distinguishable from the Sérsic profile of a massive galaxy spheroid.
Evidently, since extended ne can drastically affect an SBP as a whole, it also affects virtually all secondary photometric parameters that are derivable from it, e.g., the effective radius and Gini coefficient, and the various light concentration indices commonly used in galaxy quantitative morphology studies.
Moreover, the ne luminosity fraction in I Zw 18 ( ≥ 1/3), if typical of its higher-z analogs, translates into a systematic error of ≥ 0.4 mag in galaxy scaling relations involving total magnitudes. These range from the Tully-Fisher relation to all relations comparing luminosity with e.g. metallicity, diameter, mean surface brightness and velocity dispersion. Errors in galaxy luminosity propagate, potentially amplified, in stellar mass determinations using theoretical mass-to-light ratios or SED fitting. An investigation of this issue was recently presented by Izotov et al. (2011): these authors show that masses computed from spectral fits to the SED continuum of high-SSFR galaxies at intermediate z can be overestimated by a factor of up to ~ 4. This is not primarily due to the luminosity contribution but more to the red spectral slope of the nebular continuum (see e.g. Krüger et al. 1995) that drives SED fitting towards solutions invoking much too high a luminosity fraction from old stars. In galaxy assembly studies covering a wide range in z, downsizing effects may further complicate the aforementioned biases, since ne is expected to affect galaxy populations of different mass over different timescales.
We next turn to the color contrast δce between the HSB core and the nebular LSB envelope. This quantity can be determined easily from SBPs, or within concentric apertures, and provides a handy proxy to radial color gradients in galaxies, thus a first guess at classification. As we show below, for certain z intervals, δce offers a powerful diagnostic for identifying high-SSFR galaxies with morphological properties analogous to those of I Zw 18. Within other z intervals, however, and depending on the colors considered, a superficial interpretation of δce can further aggravate the above discussed galaxy misclassification biases.
In computing δce and its variation with z, we approximated the spectrum of I Zw 18 with synthetic stellar + ne SEDs from Pegase 2, referring to SFH2 and a metallicity Z = 0.0004. In these models, the properties of the HSB core (R⋆ ≤ 6′′) are reproduced well by a synthetic SED for an age t = 100 Myr. This yields colors of V − R = 0.2, V − I = –0.15, R − I = –0.37 mag, and an EW(Hα) of 670 Å, in good agreement with the observed values (Izotov et al. 2001a; Vílchez & Iglesias-Páramo 1998, P02). As for the envelope (6′′ ≤ R⋆ ≲ 20′′), we adopted the SED from the same model for t = 0, i.e. a purely ne spectrum. Its colors (B − V = 0.28, V − R = 0.47, B − R = 0.7, V − I = –0.65, and R − I = –1.1 mag) provide a good match to the data as well.
The variation in the B − J, V − K, V − R, V − I, and R − I colors of the core and in the envelope as a function of z is shown in the upper two panels of Fig. 15. It can be seen that the envelope (middle panel) shows particularly strong color variations, because different strong emission lines shift into the transmittance window of various filters, depending on z. As is already evident from Sect. 3.2, a local analog to I Zw 18 is easily identified by its blue nebular envelope and large (0.8 mag) δce (lower panel) both with respect to V − I and R − I. This is also the case for the redshift range 0.15 ≲ z ≲ 0.3 where the envelope appears much redder than the core in V − I but bluer in B − V. Other distinct peaks in ∥ δce ∥ with respect to various optical or optical-NIR colors are apparent for, e.g., z ≈ 0.42, 0.55, and 0.9. A comparison of the upper and lower panel of Fig. 15 shows that the δce exhibits much larger variations ( ∥ δce ∥ ≃ 1.6 mag) than the HSB core; i.e., it is a far more sensitive indicator of extended ne than integral (luminosity-weighted) colors that are primarily driven by the core. For example, at z ≈ 0.27, the V − I and B − V colors of the HSB core are equal to within ≤ 0.3 mag, whereas their δce differs by up to ≈ 1.3 mag.
 |
Fig. 15 Variation in the observed color as a function of redshift z for a template galaxy with the properties of I Zw 18. The model consists of an HSB core within which stellar emission is confined and dominates (upper panel), and a larger nebular LSB envelope (middle panel). The lower panel shows the dependence of the color contrast δce between the core and the envelope as a function of redshift. |
It is worth pointing out that, for certain redshift windows and color indices, the δce may point towards diametrically different views on the nature of an I Zw 18 analog. For instance, at 0.15 ≲ z ≲ 0.3, the large V − I core-to-envelope color contrast (δce ~ 0.8 mag) and the moderately blue colors of the core (0.5 mag) superficially suggest an old disk hosting nuclear SF activity. The opposite conclusion could be drawn from the δce in B − V (≈0.5 mag), which may be taken as evidence of a very young stellar disk encompassing a slightly older core, in line with the inside-out galaxy growth interpretation. In either case, the exponential envelope, usually interpreted as a stellar disk, would nicely augment the erroneous conclusion. Several similar cases for various color combinations and redshifts can be read off Fig. 15. Important is also that for other z’s (e.g. 0.1 ≲ z ≲ 0.15, 0.3, 0.75, 1.05), the δce vanishes to ≲ 0.2 mag for some colors, with little discriminating power between stellar and nebular emission, and superficially suggesting a nearly uniform stellar age.
With regard to all concerns above, one might counterargue that photometric k corrections would rectify SBPs and color profiles, and eliminate pitfalls in the interpretation of δce. However, state-of-art k corrections, mostly tailored to stellar SEDs and applied to a morphological analog of I Zw 18 as a whole, regardless of its physically distinct radial zones, would most probably aggravate the problem in a barely predictable manner.
In summary, the case of I Zw 18 stands as a warning benchmark to studies of high-SSFR galaxies near and far. It reminds us that nebular emission in SF galaxies is not always cospatial with the underlying local ionizing and non-ionizing stellar background, and it does not have to scale with its surface density. Quite the contrary, in galaxies with high SSFR (i.e. forming young galaxies and/or systems rapidly assembling their stellar mass during dominant phases of their evolution), nebular emission is plausibly expected to extend far beyond the galaxy itself and to contribute significantly to its total luminosity. This, in connection with the empirical evidence that nebular emission forms an exponential envelope, conspires in potentially important observational biases in studies of moderately resolved morphological analogs to I Zw 18, which are likely ubiquitous in the early universe.
Interesting in this context is also the detection of exponential Lyα halos around low (Hayes et al. 2007) and high-z SF galaxies (Steidel et al. 2011), resulting in SBPs strikingly similar to those of I Zw 18.
In principle, any strong thermal or non-thermal central source of energy and momentum could generate a large nebular envelope and a pseudo bulge-disk luminosity profile. The foregoing discussion is therefore relevant to a wider range of topics, such as the co-evolution of AGNs with their host galaxies or the properties of ionized halos around powerful radio galaxies (e.g., Villar-Martín et al. 2003, and references therein).
The prospect of spatially resolved studies of galaxy formation in the faraway universe with next-generation observing facilities calls for theoretical guidance with the properties and time evolution of nebular halos around protogalactic systems. Some questions (see also P02) to computational astrophysics include i) in which way are the photometric properties of the nebular envelope (e.g. its μ0 and α) and their temporal evolution related to the specifics of energy production (e.g. the SFH and the ionizing SED), the initial geometry, and kinematics of the protogalactic gas reservoir and the physical conditions in the intergalactic medium (e.g. external pressure, ambient ionizing field from multiple mutually “illuminating” protogalactic units)? More specifically; ii) does (for a given set of environmental conditions) the core-envelope radial intensity pattern scale in a homologous manner; i.e., is the α of the nebular envelope invariant? If not; iii) what does the core-to-envelope luminosity and normalized RSF/α ratio tell us about, e.g., the recent SFH and current SSFR? Additionally; iv) how is the photometric, chemical and kinematical evolution of the nebular envelope related to the escape probability of Ly continuum and Lyα photons?
5. Summary and conclusions
We used the entire set of archival HST ACS broad band imaging data for I Zw 18 and its fainter component I Zw 18 C to study the photometric structure of this nearby (19 Mpc) dwarf galaxy pair to unprecedently faint surface brightness levels (μ ≳ 29 mag/◻″). The main results from this study may be summarized as follows:
-
i)
Radial color profiles reveal very blue and practically constant colors(0 ± 0.05 mag) for I Zw 18 C down to μ ~ 27.6 mag/◻″, and a previously undisclosed, slightly redder (V − I = 0.2 ± 0.08 mag, R − I = 0.16 ± 0.09 mag) stellar component in its extreme periphery (27.6–29 mag/◻″). We verified that these blue colors do not merely reflect the luminosity-weighted average of blue young stellar clusters with a faint red stellar background but that they are characteristic for the unresolved host galaxy of I Zw 18 C. We argued that the buildup of the photometrically dominant stellar component of I Zw 18 C has occurred in a largely sequential mode, through an SF process that likely started τ ~ 100 Myr ago at the redder northwestern tip of the galaxy and propagated with a mean velocity of ~ 20 km s-1 to its bluer southeastern tip. The photometric properties of the extreme periphery of I Zw 18 C are entirely consistent with this formation scenario, if the effect of stellar diffusion is taken into account. Radial migration of newly forming stars with a mean velocity of ≈ 4 km s-1 over ~τ, and the associated stellar mass filtering effect described in Papaderos et al. (2002, hereafter P02), can naturally account for the slightly redder colors, absence of nebular emission (ne) and topological properties of the stellar outskirts of I Zw 18 C. A faint ancient stellar substrate cannot be ruled out, even though our analysis does not lend observational support to its presence.
-
ii)
In I Zw 18 (i.e. the main body) severe contamination of broad band colors by ne prevents a conclusive age dating of the stellar component almost everywhere. Therefore, even though our combined images are the deepest presently available, we cannot improve on the age-dating analysis by P02 who have 2D subtracted strong nebular emission lines from broad band HST WFPC2 images to isolate and age-date the residual underlying stellar background. However, the colors of the reddest quartile of region ω, a region at the southeastern tip of I Zw 18 with comparatively weak ne, were determined to be in good agreement with those previously inferred by P02. Assuming these colors are representative of the host galaxy of I Zw 18, and on the basis of a continuous or exponentially decreasing SFR model, it follows that I Zw 18 has formed most of its stellar mass at a late cosmic epoch. This, together with our conclusions under i), supports the view that both I Zw 18 and I Zw 18 C are cosmologically young objects that have undergone a nearly synchronous evolution.
-
iii)
We showed that ~20% of the isophotal area of I Zw 18 at 25 mag/◻″ is severely affected by ne, thus inaccessible to age-dating studies via broad band colors and color-magnitude diagrams (CMDs). The local impact of ne manifests itself in, e.g., a combination of red (~0.5 mag) V − R with extremely blue (–0.4 ...–0.8 mag) V − I and R − I colors. Nebular emission shows considerable sub-structure, with numerous clumps and overlapping shells, and little spatial correlation with the local stellar background. It thus cannot be treated as a uniform foreground emitting layer and accurately subtracted out using standard point source photometry algorithms. This likely results in substantial random and systematic errors that might not be fully accounted for by the standard CMD error budget. Further potential sources of systematic uncertainties stem from spatial displacements (50–100 pc) between the intensity maxima of the [Oiii]λλ4959,5007 and Hα emission lines along ionized gas shells. These may differentially affect the local background determination in different filters, causing an artificial reddening of CMD point sources in the interior of nebular shells (and vice versa).
-
iv)
Based on the extraordinarily deep combined HST ACS images, we were able to study the exponential LSB envelope of I Zw 18 out to its extreme periphery using both SBPs and color maps. These reveal uniform colors of V − R ≈ 0.55 mag, V − I ≈ −1 mag, and R − I ≈ − 1.4 mag all over the LSB component of I Zw 18, corroborating the previous conclusion by P02 that this luminosity envelope is not due to a stellar disk, but to extended ne. Specifically, our analysis indicates that ne dominates the line-of-sight intensity beyond three effective radii (or, equivalently, for μ ≥ 23.5 mag/◻″) and extends as far out as ~16 stellar exponential scale lengths. The overall picture emerging from our analysis is therefore that I Zw 18 is a cosmologically young object that consists of a compact, HSB core, within which stellar emission is confined and dominates, and a much larger nebular LSB envelope.
-
v)
We argued that the morphological properties of I Zw 18, while unique among nearby SF dwarf galaxies, are probably typical of distant young galaxies in dominant phases of their evolution, during which they assemble their stellar component at high SSFRs. The prodigious energetic output during such phases of rapid stellar mass growth is expected to result into a large-scale gas ionization and acceleration, with ne protruding much beyond the still compact stellar galaxy host. These systems could thus bear strong morphological resemblance to I Zw 18, comprising a compact core that is dominated by stellar emission and a much larger exponential nebular envelope. A question of considerable interest is, therefore, how the nebular envelope could affect photometric studies of moderately resolved morphological analogs of I Zw 18 at higher z. A potential bias, already discussed in P02, arises from the nebular envelope mimicking an evolved stellar disk by its exponentiality and red B − R color. Here, by using I Zw 18 as a template, we extended previous considerations.
-
v.1
We pointed out that the superposition of two exponential components of differing central surface brightness and scale length, approximating the core and the envelope of a distant I Zw 18 analog, may be barely distinguishable from a genuine Srsic profile with an exponent 2 ≲ η ≲ 5. Therefore, Srsic models offer, in the specific context, a poor diagnostic for disentangling compact high-SSFR protogalaxies from massive galaxy spheroids.
-
v.2
Nebular emission contributes at least one third of the total luminosity of I Zw 18 (P02 and this study). This luminosity fraction, if typical of its higher-z analogs, translates into a systematic error of ≳ 0.4 mag in all galaxy scaling relations involving luminosities (e.g., the Tully-Fisher relation, and relations between luminosity and metallicity, diameter, velocity dispersion). Evidently, errors in total luminosities propagate into errors in galaxy mass determinations via theoretical mass-to-light ratios or SED fitting techniques. Moreover, since extended ne can drastically affect a galaxy SBP as a whole, it also affects practically all secondary photometric quantities that are derivable from it (e.g. the effective radius or various light concentration indices used for quantitative galaxy morphology studies).
-
v.3
We investigated the variation in the color contrast δce between the star-dominated core and the surrounding nebular envelope as a function of z. This task is motivated by the fact that δce provides a handy proxy to radial color gradients in galaxies and a valuable galaxy classification tool. We show that, for certain z intervals, this quantity offers a powerful diagnostic for identifying moderately resolved I Zw 18 analogs. Within other z intervals, however, and depending on the color indices considered, a superficial interpretation of δce can further enhance galaxy misclassification biases stemming from SBP fitting (cf. v.1) and potentially affect our understanding of galaxy assembly over time. State-of-art k corrections applied to distant morphological analogs to I Zw 18 as a whole, i.e. regardless of their physically distinct radial zones, may aggravate observational and interpretation biases in a barely predictable manner.
In the era of spatially resolved studies of galaxy formation in the early universe with next-generation observing facilities, a better theoretical understanding of the rise and fall of nebular galaxy halos over cosmic time appears to be crucial. In this respect, we have formulated some questions for computational astrophysics.
Acknowledgments
Polychronis Papaderos is supported by a Ciencia 2008 contract, funded by FCT/MCTES (Portugal) and POPH/FSE (EC). He also acknowledges support by the Wenner-Gren Foundation. Göran Östlin acknowledges support from the Swedish Research council (VR) and the Swedish National Space Board (SNSB). He is a Royal Swedish Academy of Sciences research fellow, supported by a grant from the Knut and Alice Wallenberg foundation. A careful reading and constructive report by the referee is very much appreciated. This research made use of data acquired with the European Southern Observatory telescopes, and obtained from the ESO/ST-ECF Science Archive Facility and of the NASA/IPAC Extragalactic Database (NED), which is operated by the Jet Propulsion Laboratory, CALTECH, under contract with the National Aeronautic and Space Administration.
References
- Aloisi, A., Tosi, M., & Greggio, L. 1999, AJ, 118, 302 [NASA ADS] [CrossRef] [Google Scholar]
- Aloisi, A., Savaglio, S., Heckman, T. M., et al. 2003, ApJ, 595, 760 [NASA ADS] [CrossRef] [Google Scholar]
- Amorín, R., Alfonso, J., Aguerri, L., Muñoz-Tuñón, C., & Cairós, L. M. 2009, A&A, 501, 75 [NASA ADS] [CrossRef] [EDP Sciences] [Google Scholar]
- Amorín, R., Pérez-Montero, E., & Vílchez, J. M. 2010, ApJ, 715, L128 [NASA ADS] [CrossRef] [Google Scholar]
- Anders, P., de Grijs, R., Fritze-v. Alvensleben, U., & Bissantz, N. 2004, MNRAS, 347, 17 [NASA ADS] [CrossRef] [Google Scholar]
- Beckwith, S. V. W., Stiavelli, M., Koekemoer, A. M., et al. 2006, AJ, 132, 1729 [NASA ADS] [CrossRef] [Google Scholar]
- Bender, R., & Möllenhoff, C. 1987, A&A, 177, 71 [NASA ADS] [Google Scholar]
- Bergvall, N. 1985, A&A, 146, 269 [NASA ADS] [Google Scholar]
- Bergvall, N., & Östlin, G. 2002, A&A, 390, 891 [NASA ADS] [CrossRef] [EDP Sciences] [Google Scholar]
- Bergvall, N., Zackrisson, E., & Caldwell, B. 2010, MNRAS, 405, 2697 [NASA ADS] [Google Scholar]
- Binggeli, B., & Cameron, L. M. 1991, A&A, 252, 27 [NASA ADS] [Google Scholar]
- Binggeli, B., & Cameron, L. M. 1993, A&AS, 98, 297 [NASA ADS] [Google Scholar]
- Bomans, D. J. 2002, in Dwarf Galaxies and their Environment, ed. K. S. de Boer, R.-J. Dettmar, & U. Klein (Shaker Verlag), 145 [Google Scholar]
- Cairós, L. M., Vílchez, J. M., Gónzalez-Pérez, J. N., Iglesias-Páramo, J., & Caon, N. 2001, ApJS, 133, 321 [NASA ADS] [CrossRef] [Google Scholar]
- Cairós, L. M., Caon, N., García Lorenzo, B., Vílchez, J. M., & Muñoz-Tuñón, C. 2002, ApJ, 577, 164 [NASA ADS] [CrossRef] [Google Scholar]
- Cairós, L. M., Caon, N., Papaderos, P., et al. 2009, ApJ, 707, 1676 [NASA ADS] [CrossRef] [Google Scholar]
- Cannon, J. M., Skillman, E. D., Garnett, D. R., & Dufour, R. J. 2002, ApJ, 565, 931 [CrossRef] [Google Scholar]
- Cardamone, C., Schawinski, K., Sarzi, M., et al. 2009, MNRAS, 399, 1191 [NASA ADS] [CrossRef] [Google Scholar]
- Cerviño, M., & Mas-Hesse, J. M. 1994, A&A, 284, 749 [NASA ADS] [Google Scholar]
- Crone, M. M., Schulte-Ladbeck, R. E., Greggio, L., & Hopp, U. 2002, ApJ, 567, 258 [NASA ADS] [CrossRef] [Google Scholar]
- Davidson, K., Kinman, T. D., & Friedman, S. D. 1989, AJ, 97, 1591 [NASA ADS] [CrossRef] [Google Scholar]
- Dufour, R. J., & Hester, J. J. 1990, ApJ, 350, 149 [NASA ADS] [CrossRef] [Google Scholar]
- Dufour, R. J., Esteban, C., & Castañeda, H. O. 1996a, ApJ, 471, L87 [NASA ADS] [CrossRef] [Google Scholar]
- Dufour, R. J., Garnett, D. R., Skillman, E. D., & Shields, G. A. 1996b, in From Stars To Galaxies, ed. C. Leitherer, U. Fritze-v. Alvensleben, & J. Huchra, ASP Conf. Ser., 98, 358 [Google Scholar]
- Ferguson, A. M. N., Wyse, R. F. G., Gallagher, J. S., & Hunter, D. A. 1996, AJ, 111, 2265 [NASA ADS] [CrossRef] [Google Scholar]
- Finlator, K., Oppenheimer, B. D., & Davé, R. 2011, MNRAS, 410, 1703 [NASA ADS] [Google Scholar]
- Fioc, M., & Rocca-Volmerange, B. 1997, A&A, 326, 950 [NASA ADS] [Google Scholar]
- Fiorentino, G., Contreras Ramos, R., Clementini, G., et al. 2010, ApJ, 711, 808 [NASA ADS] [CrossRef] [PubMed] [Google Scholar]
- French, H. B. 1980, ApJ, 240, 41 [NASA ADS] [CrossRef] [Google Scholar]
- Fricke, K. J., Izotov, Y. I., Papaderos, P., Guseva, N. G., & Thuan, T. X. 2001, AJ, 121, 169 [NASA ADS] [CrossRef] [Google Scholar]
- Gallagher, J. S., Bushouse, H., & Hunter, D. A. 1989, AJ, 97, 700 [NASA ADS] [CrossRef] [Google Scholar]
- Gil de Paz, A., & Madore, B. F. 2005, ApJS, 156, 345 [NASA ADS] [CrossRef] [EDP Sciences] [Google Scholar]
- Gil de Paz, A., Madore, B. F., & Pevunova, O. 2003, ApJS, 147, 29 [NASA ADS] [CrossRef] [Google Scholar]
- Guseva, N. G., Izotov, Y. I., Papaderos, P., et al. 2001, A&A, 378, 756 [NASA ADS] [CrossRef] [EDP Sciences] [Google Scholar]
- Guseva, N. G., Papaderos, P., Izotov, Y. I., Noeske, K. G., & Fricke, K. J. 2004, A&A, 421, 519 [NASA ADS] [CrossRef] [EDP Sciences] [Google Scholar]
- Guseva, N. G., Papaderos, P., Meyer, H. T., Izotov, Y. I., & Fricke, K. J. 2009, A&A, 505, 63 [NASA ADS] [CrossRef] [EDP Sciences] [Google Scholar]
- Guzmán, R., Jangren, A., Koo, D. C., Bershady, M. A., & Simard, L. 1998, ApJ, 495, L13 [NASA ADS] [CrossRef] [Google Scholar]
- Guzmán, R., Östlin, G., Kunth, D., et al. 2003, ApJ, 586, L45 [NASA ADS] [CrossRef] [Google Scholar]
- Hayes, M., Östlin, G., Hakim, A., et al. 2007, MNRAS, 382, 1465 [NASA ADS] [Google Scholar]
- Huchra, J. P. 1977, ApJ, 217, 928 [NASA ADS] [CrossRef] [Google Scholar]
- Hunt, L. K., Thuan, T. X., & Izotov, Y. I. 2003, ApJ, 588, 281 [NASA ADS] [CrossRef] [Google Scholar]
- Hunter, D. A., & Gallagher, J. S. 1985, ApJS, 58, 533 [NASA ADS] [CrossRef] [Google Scholar]
- Hunter, D. A., & Gallagher, J. S. 1990, ApJ, 362, 480 [NASA ADS] [CrossRef] [Google Scholar]
- Hunter, D. A., & Gallagher, J. S. 1992, ApJ, 391, L9 [NASA ADS] [CrossRef] [Google Scholar]
- Hunter, D. A., & Thronson, H. A., Jr. 1995, ApJ, 452, 238 [NASA ADS] [CrossRef] [Google Scholar]
- Izotov, Y. I., & Thuan, T. X. 1998a, ApJ, 497, 227 [NASA ADS] [CrossRef] [Google Scholar]
- Izotov, Y. I., & Thuan, T. X. 1998b, ApJ, 500, 188 [NASA ADS] [CrossRef] [Google Scholar]
- Izotov, Y. I., & Thuan, T. X. 1999, ApJ, 511, 639 [NASA ADS] [CrossRef] [Google Scholar]
- Izotov, Y. I., & Thuan, T. X. 2004, ApJ, 616, 768 [CrossRef] [Google Scholar]
- Izotov, Y. I., & Thuan, T. X. 2007, ApJ, 665, 1115 [NASA ADS] [CrossRef] [Google Scholar]
- Izotov, Y. I., Lipovetsky, V. A., et al. 1997a, ApJ, 476, 698 [NASA ADS] [CrossRef] [Google Scholar]
- Izotov, Y. I., Foltz, C. B., Green, R. F., Guseva, N. G., & Thuan, T. X. 1997b, ApJ, 487, L37 [NASA ADS] [CrossRef] [Google Scholar]
- Izotov, Y. I., Papaderos, P., Thuan, T. X., et al. 1999a, unpublished [arXiv:astro-ph/9907082] [Google Scholar]
- Izotov, Y. I., Chaffee, F. H., Foltz, C. B., et al. 1999b, ApJ, 527, 757 [NASA ADS] [CrossRef] [Google Scholar]
- Izotov, Y. I., Chaffee, F. H., Foltz, C. B., et al. 2001a, ApJ, 560, 222 [NASA ADS] [CrossRef] [Google Scholar]
- Izotov, Y. I., Chaffee, F. H., & Schaerer, D. 2001b, A&A, 378, L45 [NASA ADS] [CrossRef] [EDP Sciences] [Google Scholar]
- Izotov, Y. I., Thuan, T. X., & Guseva, N. G. 2005, ApJ, 415, 87 [Google Scholar]
- Izotov, Y. I., Schaerer, D., Blecha, A., et al. 2006, A&A, 459, 71 [NASA ADS] [CrossRef] [EDP Sciences] [Google Scholar]
- Izotov, Y. I., Guseva, N. G., Fricke, K. J., & Papaderos, P. 2009, A&A, 503, 61 [NASA ADS] [CrossRef] [EDP Sciences] [Google Scholar]
- Izotov, Y. I., Guseva, N. G., & Thuan, T. X. 2011, ApJ, 727, 161 [NASA ADS] [CrossRef] [Google Scholar]
- Jamet, L., Cerviño, M., Luridiana, V., Pérez, E., & Yakobchuk, T. 2010, A&A, 509, A10 [NASA ADS] [CrossRef] [EDP Sciences] [Google Scholar]
- Jee, M. J., Blakeslee, J. P., Sirianni, M., et al. 2007, PASP, 119, 1403 [NASA ADS] [CrossRef] [Google Scholar]
- Kinman, T. D., & Davidson, K. 1981, ApJ, 243, 127 [NASA ADS] [CrossRef] [Google Scholar]
- Knollmann, S. R. 2004, Diploma Thesis, University of Göttingen [Google Scholar]
- Koo, D. C., Bershady, M. A., Wirth, G. D., Stanford, S. A., & Majewski, S. R. 1994, ApJ, 427, L9 [NASA ADS] [CrossRef] [Google Scholar]
- Koopmann, R. A., & Kenney, J. D. P. 2006, ApJS, 162, 97 [NASA ADS] [CrossRef] [Google Scholar]
- Kotulla, R., Fritze, U., Weilbacher, P., & Anders, P. 2009, MNRAS, 396, 462 [NASA ADS] [CrossRef] [Google Scholar]
- Krüger, H., Fritze-v. Alvensleben, U., & Loose, H.-H. 1995, A&A, 303, 41 [NASA ADS] [Google Scholar]
- Kunth, D., & Östlin, G. 2000, A&ARv, 10, 1 (KÖ00) [NASA ADS] [CrossRef] [Google Scholar]
- Kunth, D., Lequeux, J., Sargent, W. L. W., & Viallefond, F. 1994, A&A, 282, 709 [NASA ADS] [Google Scholar]
- Lecavelier des Etangs, A., Désert, J.-M., Kunth, D., et al. 2004, A&A, 413, 131 [NASA ADS] [CrossRef] [EDP Sciences] [Google Scholar]
- Legrand, F. 2000, A&A, 354, 504 [NASA ADS] [Google Scholar]
- Legrand, F., Kunth, D., Roy, J.-R., Mas-Hesse, J. M., & Walsh, J. R. 1997, A&A, 326, L17 [NASA ADS] [Google Scholar]
- Legrand, F., Tenorio-Tagle, G., Silich, S., Kunth, D., & Cerviño, M. 2001, ApJ, 560, 630 [NASA ADS] [CrossRef] [Google Scholar]
- Lee, J. C., Kennicutt, R. C., Funes, S. J., et al. 2007, ApJ, 671, L113 [NASA ADS] [CrossRef] [Google Scholar]
- Leitherer, C., Schaerer, D., Goldader, J. D., et al. 1999, ApJS, 123, 3 [NASA ADS] [CrossRef] [Google Scholar]
- Lequeux, J., Rayo, J. F., Serrano, A., Peimbert, M., & Torres-Peimbert, S. 1979, A&A, 80, 155 [NASA ADS] [Google Scholar]
- Leroy, A., Cannon, J., Walter, F., Bolatto, A., & Weiss, A. 2007, ApJ, 663, 990 [NASA ADS] [CrossRef] [MathSciNet] [Google Scholar]
- Loose, H.-H., & Thuan, T. X. 1986, in Star Forming Dwarf Galaxies and Related Objects, ed. D. Kunth, T. X. Thuan, & J. Tran Thanh Van (Éditions Frontières), 73 (LT86) [Google Scholar]
- Marlowe, A. T., Heckman, T. M., Wyse, R. F. G., & Schommer, R. 1995, ApJ, 438, 563 [NASA ADS] [CrossRef] [Google Scholar]
- Martin, C. L. 1996, ApJ, 465, 680 [NASA ADS] [CrossRef] [Google Scholar]
- Martin, C. L. 1998, ApJ, 506, 222 [NASA ADS] [CrossRef] [Google Scholar]
- Martín-Manjón, M. L., García-Vargas, M. L., Mollá, M., & Díaz, A. I. 2010, MNRAS, 403, 2012 [NASA ADS] [CrossRef] [Google Scholar]
- Mateo, M. 1998, ARA&A, 36, 435 [NASA ADS] [CrossRef] [Google Scholar]
- Matteucci, F., & Tosi, M. 1985, MNRAS, 217, 391 [NASA ADS] [Google Scholar]
- Mas-Hesse, J. M., & Kunth, D. 1999, A&A, 349, 765 [NASA ADS] [Google Scholar]
- McCray, R., & Kafatos, M. 1987, ApJ, 317, 190 [NASA ADS] [CrossRef] [Google Scholar]
- Meurer, G. R., Freeman, K. C., Dopita, M. A., & Cacciari, C. 1992, AJ, 103, 60 [NASA ADS] [CrossRef] [Google Scholar]
- Momany, Y., Held, E. V., Saviane, L. R., et al. 2005, A&A, 439, 111 [NASA ADS] [CrossRef] [EDP Sciences] [Google Scholar]
- Monreal-Ibero, A., Vílchez, J. M., Walsh, J. R., & Muñoz-Tuñón, C. 2010, A&A, 517, A27 [NASA ADS] [CrossRef] [EDP Sciences] [Google Scholar]
- Moustakas, J., & Kennicutt, R. C. 2006, ApJS, 164, 81 [NASA ADS] [CrossRef] [Google Scholar]
- Moy, E., Rocca-Volmerange, B., & Fioc, M. 2001, A&A, 365, 347 [NASA ADS] [CrossRef] [EDP Sciences] [Google Scholar]
- Noeske, K. G., Papaderos, P., Cairós, L. M., & Fricke, K. J. 2003, A&A, 410, 481 [NASA ADS] [CrossRef] [EDP Sciences] [Google Scholar]
- Noeske, K. G., Koo, D. C., Phillips, A. C., et al. 2006, ApJ, 640, L143 [NASA ADS] [CrossRef] [Google Scholar]
- Olofsson, K. 1989, A&A, 80, 317 [Google Scholar]
- Ono, Y., Ouchi, M., Shimasaku, K., et al. 2010, ApJ, 724, 1524 [NASA ADS] [CrossRef] [Google Scholar]
- Östlin, G. 2000, ApJ, 535, 99 [Google Scholar]
- Östlin, G., & Mouhcine, M. 2005, A&A, 433, 797 [NASA ADS] [CrossRef] [EDP Sciences] [Google Scholar]
- Östlin, G., Bergvall, N., & Rönnback, J. 1996, in The Interplay Between Massive Star Formation, the ISM and Galaxy Formation, ed. D. Kunth, B. Guiderdoni, M. Heydari-Malayeri & T. X. Thuan (Gif-sur-Yvette: Éditions Frontières), 605 [Google Scholar]
- Östlin, G., Zackrisson, E., Bergvall, N., & Rönnback, J. 2003, A&A, 408, 887 [NASA ADS] [CrossRef] [EDP Sciences] [Google Scholar]
- Pagel, B. E. J., Simonson, E. A., Terlevich, R. J., & Edmunds, M. G. 1992, MNRAS, 255, 325 [NASA ADS] [CrossRef] [Google Scholar]
- Panuzzo, P., Bressan, A., Granato, G. L., Silva, L., & Danese, L. 2003, A&A, 409, 99 [NASA ADS] [CrossRef] [EDP Sciences] [Google Scholar]
- Papaderos, P., & Fricke, K. J. 1998, in Highlights in X-ray Astronomy, ed. B. Aschenbach, & M. J. Freyberg, MPE Report, 272, 193 [Google Scholar]
- Papaderos, P., Loose, H.-H., Thuan, T. X., & Fricke, K. J. 1996a, A&AS, 120, 207 (P96a) [NASA ADS] [CrossRef] [EDP Sciences] [Google Scholar]
- Papaderos, P., Loose, H.-H., Fricke, K. J., & Thuan, T. X. 1996b, A&A, 314, 59 (P96b) [NASA ADS] [Google Scholar]
- Papaderos, P., Izotov, Y. I., Fricke, K. J., Thuan, T. X., & Guseva, N. G. 1998, A&A, 338, 43 (P98) [NASA ADS] [Google Scholar]
- Papaderos, P., Fricke, K. J., Thuan, T. X., Izotov, Y. I., & Nicklas, H. 1999, A&A, 352, L57 [NASA ADS] [Google Scholar]
- Papaderos, P., Izotov, Y. I., Noeske, K. G., Thuan, T. X., & Fricke, K. J. 2001, in Dwarf Galaxies and their Environment, ed. K. S. de Boer, R.-J. Dettmar & U. Klein (Shaker Verlag), 111 [Google Scholar]
- Papaderos, P., Izotov, Y. I., Thuan, T. X., et al. 2002, A&A, 393, 461 (P02) [NASA ADS] [CrossRef] [EDP Sciences] [Google Scholar]
- Papaderos, P., Izotov, Y. I., Guseva, N. G., Thuan, T. X., & Fricke, K. J. 2006a, A&A, 454, 119 [NASA ADS] [CrossRef] [EDP Sciences] [Google Scholar]
- Papaderos, P., Guseva, N. G., Izotov, Y. I., et al. 2006b, A&A, 457, 45 [NASA ADS] [CrossRef] [EDP Sciences] [Google Scholar]
- Papaderos, P., Guseva, N. G., Izotov, Y. I., & Fricke, K. J. 2008, A&A, 491, 113 [NASA ADS] [CrossRef] [EDP Sciences] [Google Scholar]
- Patterson, R. J., & Thuan, T. X. 1996, ApJS, 107, 103 [NASA ADS] [CrossRef] [Google Scholar]
- Peng, C. Y., Ho, L. C., Impey, C. D., & Rix, H.-W. 2002, AJ, 124, 266 [NASA ADS] [CrossRef] [Google Scholar]
- Péquignot, D. 2008, A&A, 478, 371 [NASA ADS] [CrossRef] [EDP Sciences] [Google Scholar]
- Petrosian, A. R., Boulesteix, J., Comte, G., Kunth, D., & LeCoarer, E. 1997, A&A, 318, 390 [NASA ADS] [Google Scholar]
- Pflamm-Altenburg, J., Weidner, C., & Kroupa, P. 2009, MNRAS, 395, 394 [NASA ADS] [CrossRef] [Google Scholar]
- Puech, M., Hammer, F., Flores, H., Östlin, G., & Marquart, T. 2006, A&A, 455, 119 [NASA ADS] [CrossRef] [EDP Sciences] [Google Scholar]
- Pustilnik, S. A., Kniazev, A. Y., & Pramskij, A. G. 2005, A&A, 443, 91 [NASA ADS] [CrossRef] [EDP Sciences] [Google Scholar]
- Recchi, S., Matteucci, F., D’Ercole, A., & Tosi, M. 2004, A&A, 426, 37 [NASA ADS] [CrossRef] [EDP Sciences] [Google Scholar]
- Reines, A. E., Johnson, K. E., & Hunt, L. K. 2008, AJ, 136, 1415 [NASA ADS] [CrossRef] [Google Scholar]
- Relaño, M., Monreal-Ibero, A., Vílchez, J. M., & Kennicutt, R. C. 2010, MNRAS, 402, 1635 [NASA ADS] [CrossRef] [Google Scholar]
- Reverte, D., Vílchez, J. M., Hernández-Fernández, J. D., & Iglesias-Páramo, J. 2007, AJ, 133, 705 [NASA ADS] [CrossRef] [Google Scholar]
- Rönnback, J., & Bergvall, N. 1994, A&AS, 108, 193 [NASA ADS] [Google Scholar]
- Roy, J.-R., & Kunth, D. 1995, A&A, 294, 432 [NASA ADS] [Google Scholar]
- Salzer, J. J., MacAlpine, G. M., & Boroson, T. A. 1989, ApJS, 70, 447 [NASA ADS] [CrossRef] [Google Scholar]
- Sánchez Almeida, J., Muñoz-Tuñón, C., Amorín, R., et al. 2008, ApJ, 685, 194 [NASA ADS] [CrossRef] [Google Scholar]
- Sargent, W. L. W., & Searle, L. 1970, ApJ, 162, L155 [NASA ADS] [CrossRef] [Google Scholar]
- Searle, L., & Sargent, W. L. W. 1972, ApJ, 173, 25 [NASA ADS] [CrossRef] [Google Scholar]
- Schaerer, D., & de Barros, S. 2009, A&A, 502, 423 [NASA ADS] [CrossRef] [EDP Sciences] [Google Scholar]
- Simard, L. 1998, in Astronomical Data Analysis Software and Systems VII, ed. R. Albrecht, R. N. Hook, & H. A. Bushouse (San Francisco: ASP), ASP Conf. Ser., 145, 108 [Google Scholar]
- Skillman, E. D., & Kennicutt, R. C., Jr. 1993, ApJ, 411, 655 [NASA ADS] [CrossRef] [Google Scholar]
- Stasińska, G., & Schaerer, D. 1999, A&A, 351, 72 [NASA ADS] [Google Scholar]
- Steidel, C. C., Bogosavljević, M., Shapley, A. E., et al. 2011, ApJ, 736, 160 [NASA ADS] [CrossRef] [Google Scholar]
- Stetson, P. B. 1979, PASP, 99, 191 [Google Scholar]
- Stockton, A., McGrath, E., Ganalizo, G., Iye, M., & Maihara, T. 2008, ApJ, 672, 146 [NASA ADS] [CrossRef] [Google Scholar]
- Terlevich, R., Melnick, J., Masegosa, J., Moles, M., & Copetti, M. V. F. 1991, A&AS, 91, 285 [NASA ADS] [Google Scholar]
- Tikhonov, N. A. 2007, Astron. Lett., 33, 3 [Google Scholar]
- Tosi, M., Sabbi, E., Bellazzini, M., et al. 2001, AJ, 122, 1271 [NASA ADS] [CrossRef] [Google Scholar]
- Tosi, M., Aloisi, A., Mack, J., Maio, M. 2007, in Galaxy Evolution Across the Hubble Time, ed. F. Combes, & J. Palous, IAU Symp., 235, 65 [Google Scholar]
- van Dokkum, P. G., Whitaker, K. E., Brammer, G., et al. 2010, ApJ, 709, 1018 [NASA ADS] [CrossRef] [Google Scholar]
- van Zee, L. 2000, AJ, 119, 2757 [NASA ADS] [CrossRef] [Google Scholar]
- van Zee, L., Westphahl, D., Haynes, M., & Salzer, J. J. 1998, AJ, 115, 1000 [NASA ADS] [CrossRef] [Google Scholar]
- Viallefond, F., Lequeux, J., & Comte, C. 1987, in Starbursts and Galaxy Evolution, ed. T. X. Thuan, T. Montmerle, & J. Tran Thanh Van (Éditions Frontières), 139 [Google Scholar]
- Vílchez, J. M., & Iglesias-Páramo, J. 1998, ApJ, 508, 248 [NASA ADS] [CrossRef] [Google Scholar]
- Villar-Martín, M., Vernet, J., di Serego Alighieri, S., et al. 2003, MNRAS, 346, 273 [NASA ADS] [CrossRef] [Google Scholar]
- Weidner, C., & Kroupa, P. 2005, ApJ, 625, 754 [NASA ADS] [CrossRef] [Google Scholar]
- Westmoquette, M. S., Exter, K. M., Smith, L. J., & Gallagher, J. S. 2007, MNRAS, 381, 894 [NASA ADS] [CrossRef] [Google Scholar]
- Yakobchuk, T. M., & Izotov, Y. I. 2006, Kinematika i Fizika Nebesnykh Tel, 22, 432 [NASA ADS] [Google Scholar]
- Zackrisson, E., Bergvall, N., Olofsson, K., & Siebert, A. 2001, A&A, 375, 814 [NASA ADS] [CrossRef] [EDP Sciences] [Google Scholar]
- Zackrisson, E., Bergvall, N., Östlin, G., Micheva, G., & Leksell, M. 2006, ApJ, 650, 812 [NASA ADS] [CrossRef] [Google Scholar]
- Zackrisson, E., Bergvall, N., & Leitet, E. 2008, ApJ, 676, L9 [NASA ADS] [CrossRef] [Google Scholar]
- Zackrisson, E., Micheva, G., & Östlin, G. 2009, MNRAS, 397, 2057 [NASA ADS] [CrossRef] [Google Scholar]
- Zwicky, F. 1966, ApJ, 143, 192 [NASA ADS] [CrossRef] [Google Scholar]
All Figures
|
Fig. 1 Three-color composite image of I Zw 18 and I Zw 18 C, combining HST ACS data in V, R, and I (blue, green, and red channels, respectively). The position of the SF regions NW and SE is indicated by crosses. The regions labeled “Loop” and “Hα arc” were studied through deep Keck II long slit spectroscopy by Izotov et al. (2001a). The region ω at the southeastern tip of I Zw 18 shows comparatively weak nebular emission, its colors therefore allow meaningful constraints to be placed on the age of the stellar component (Papaderos et al. 2002). In the magnified version of region NW (inset), combining the unsharp masked images Ic, Rc, and Vc (see Sect. 3 for details), about 30 point sources, surrounded by a complex network of ionized gas shells are discernible. The irregular blue galaxy I Zw 18 C is located ~22′′ northwest of region NW ( ≈ 2 kpc at the assumed distance of 19 Mpc to I Zw 18). It shows faint nebular emission in its bluer southeastern tip and central star cluster complex C (Izotov et al. 2001a). North is at the top and east to the left. |
| In the text | |
|
Fig. 2 Combined I band exposure of I Zw 18 and I Zw 18 C with point- and compact sources in the vicinity of the galaxies (polygonal regions A and B) marked with rectangles. North is up and east to the left. |
| In the text | |
|
Fig. 3 a) Surface brightness profiles (SBPs) of I Zw 18 C in V (F555W), R (F606W) and I (F814W). The thick gray curve shows a fit to the V SBP for R⋆ ≥ 3 |
| In the text | |
|
Fig. 4 a) Three-color composite of the images Rc, Vc and Ic (red, green, and blue image channels, respectively), illustrating the spatial distribution of compact ( ≤ 0 |
| In the text | |
|
Fig. 5 (upper panel) V, R, and I SBPs of I Zw 18. The thick-solid and thin-dashed lines show linear fits to the V SBP in the radius range 7′′ ≤ R⋆ ≤ 15′′ and R⋆ ≥ 7′′, respectively. The effective radius Reff and the radius R80 enclosing 80% of the total V emission are indicated. The V SBP derived by P02 after subtraction of the Hβ and [Oiii]λλ4959, 5007 emission lines (referred to as V′), shifted by +1 mag for the sake of clarity, is included for comparison. (lower panel) V − R (filled circles), V − I (squares), and R − I (open circles) color profiles, computed from the SBPs in the upper panel. The vertical bar indicates the V − I color range inferred by P02 from ground-based and HST PC data for region ω at the southeastern tip of I Zw 18 (V − I(ω) = 0.17 ...0.32 mag). The mean V − R color of I Zw 18’s host after subtraction of nebular line emission (V′ – R′ = 0.12 ± 0.04 mag; P02) is indicated by the horizontal line. The colors V − I(ω) and V′ – R′ of the stellar host galaxy are by, respectively, ≳ 0.8 mag redder and ≈ 0.4 mag bluer than the colors of the exponential nebular envelope (R⋆ ≥ 6′′). |
| In the text | |
|
Fig. 6 V − R (left panel) and R − I (right panel) color map of I Zw 18, displayed in the range between 0 and 0.4 mag and –0.9 and 0 mag, respectively. Crosses mark the SF regions NW and SE. The region termed ω by P02 (cf. Fig. 1) is indicated at the southeastern part of the image. The insets in the left panel show a magnified view of a shell ≈ 5′′ northward of region NW. |
| In the text | |
|
Fig. 7 V − I map of the central 15 |
| In the text | |
|
Fig. 8 Composite image of I Zw 18 and I Zw 18 C with the R, I, and V bands shown in the red, green, and blue channels, respectively. The contours, adapted from P02, are computed from HST WFPC2 R data, after 2D subtraction of the Hα emission (referred to as R′), they thus delineate the morphology of the stellar and nebular continuum emission in the main body of I Zw 18. Contours go from 19 to 25 R′ in steps of 0.5 mag. |
| In the text | |
|
Fig. 9 Three-color image of I Zw 18 displaying the unresolved stellar emission (Id) in the red channel and the R and V emission of compact ne-dominated regions in the green and blue channels. White areas in the central (red) part of the galaxy depict regions whose colors are strongly affected by nebular emission, as is apparent from their extremely blue V − I and R − I (<–0.4 ...–0.8) colors. The inset, showing a magnified portion of the western supershell, is meant to illustrate a subtle spatial shift between the Vc and Rc emission. This can be attributed to a spatial displacement by 30–100 pc between the intensity maxima of the [Oiii]λλ4959, 5007 and Hα emission lines. |
| In the text | |
|
Fig. 10 Schematic illustration of the effect that the slight spatial displacement between the [Oiii]λλ4959, 5007 and the Hα emission lines across an expanding shell of ionized gas might have on the V and R photometry of stars in its close vicinity. The shell, of thickness 100 pc ( ≈ 1′′at the distance to I Zw 18), comprises an inner and outer zone with, respectively, higher and lower [Oiii]/Hα ratios (cf. the discussion related to Figs. 6 and 9). |
| In the text | |
|
Fig. 11 Comparison of the V − I and R − I colors of I Zw 18 C and of region ω in I Zw 18 with model predictions for a stellar population forming instantaneously (SFH1: thick dotted curve) or continuously, with an exponentially decreasing or constant star formation rate (SFH2 and SFH3: thick solid and dashed lines, respectively). The models have been computed with Pegase 2.0 (Fioc & Rocca-Volmerange 1997) for a constant metallicity (Z = 0.001) and a Salpeter initial mass function between 0.1 and 100 M⊙, and do not include nebular emission. Thin curves correspond to the same star formation histories but assume an IMF truncated above 5 M⊙. The vertical bars labeled I Zw 18ω depict the range between the mean and reddest color in region ω of I Zw 18 (V − I = 0.2 ...0.3 and R − I = –0.06 ...0.15). Bars labeled I Zw 18 C (1′′–6′′) indicate the mean color of I Zw 18 C in the radius range 1′′ ≤ R⋆ ≤ 6′′ ( ≈ 0 ± 0.05 mag). The mean colors and their 1σ uncertainties in the extreme periphery (R⋆ ≥ 6′′) of I Zw 18 C at μ ≳ 27.6 mag/◻″ are depicted by the rectangular areas. |
| In the text | |
|
Fig. 12 Schematic comparison of typical blue compact dwarf (BCD) galaxies (left) with I Zw 18 (right) with respect to the morphology and radial intensity distribution (upper and lower figures, respectively) of their stellar and nebular emission. |
| In the text | |
|
Fig. 13 Upper panel: comparison of the R SBP of I Zw 18 (filled circles), with a synthetic SBP (labeled core+env1) that is due to the superposition of two exponential components of differing central surface brightness μ0 and exponential scale length α. The first one, labeled core (open circles) approximates the stellar component that is confined to and dominates within the inner (R⋆ ≤ 6′′) HSB part of the observed SBP. The second component (env1; dotted line intersecting the abscisca at μ ~ 22 mag/◻″) is a linear fit to the nebular LSB envelope. A Sérsic model to the composite core+env1 SBP (orange solid-line curve) yields a Sérsic exponent η ≈ 2, close to the best-fitting value of η ≈ 2.2 for the observed SBP. The synthetic SBP labeled core+env2 (red solid-line curve) is computed by superposing on the core an exponential nebular envelope of equal luminosity but twice as large α as the observed envelope env1. A Sérsic fit to core+env2 (thin curve) yields an η ≈ 5. Lower panel: residuals between the synthetic SBPs core+env1 (thin curve) and core+env2 (thick curve) and their Sérsic fits when the latter are computed down to a surface brightness level μlim of 26.5 and 29 mag/◻″ (solid and dotted curves, respectively). |
| In the text | |
|
Fig. 14 Best-fitting Sérsic exponent η vs. μlim for the SBPs in Fig. 13. The thick-gray curve and the filled squares show, respectively, the variation in η for the observed R band SBP of I Zw 18 and the two-component approximation to it, labeled core+env1. The variation in η with μeff for the synthetic SBP core+env2 is shown with filled circles. |
| In the text | |
|
Fig. 15 Variation in the observed color as a function of redshift z for a template galaxy with the properties of I Zw 18. The model consists of an HSB core within which stellar emission is confined and dominates (upper panel), and a larger nebular LSB envelope (middle panel). The lower panel shows the dependence of the color contrast δce between the core and the envelope as a function of redshift. |
| In the text | |
Current usage metrics show cumulative count of Article Views (full-text article views including HTML views, PDF and ePub downloads, according to the available data) and Abstracts Views on Vision4Press platform.
Data correspond to usage on the plateform after 2015. The current usage metrics is available 48-96 hours after online publication and is updated daily on week days.
Initial download of the metrics may take a while.