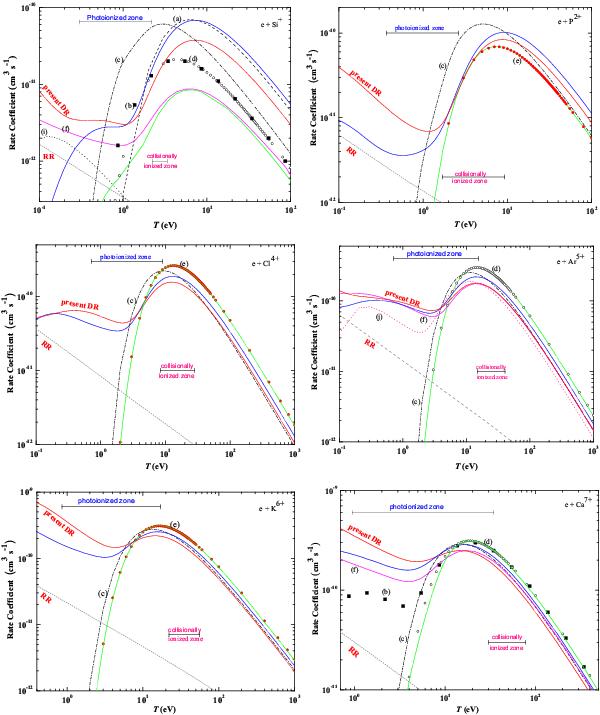
Fig. 1

Present Maxwellian-averaged DR and RR rate coefficients for Si ii-Ca viii ions (excluding S iv − see Fig. 4): red solid curve, present IC; blue solid curve, present LS; green solid curve, previous recommended compilation (Mazzotta et al. 1998); gray dashed curve, present RR rate coefficient; (a) black dashed curve, Burgess formula (Aldrovandi & Péquignot 1973); (b) black squares, LS (Jacobs et al. 1979); (c) black dash dotted curve, empirical formula (Mewe et al. 1980); (d) open circles, fitted data (Shull & Van Steenberg 1982); (e) red circles, extrapolated fits (Landini & Monsignori Fossi 1991); (f) magenta solid curve, LSR-matrix, RR + DR (Nahar & Pradhan 1995; Nahar 1996, 2000); (i) black dotted curve, low temperature data (Nussbaumer & Storey 1986); and (j) pink dotted curve, configuration-average distorted-wave results (Loch et al. 2007).
Current usage metrics show cumulative count of Article Views (full-text article views including HTML views, PDF and ePub downloads, according to the available data) and Abstracts Views on Vision4Press platform.
Data correspond to usage on the plateform after 2015. The current usage metrics is available 48-96 hours after online publication and is updated daily on week days.
Initial download of the metrics may take a while.


