Fig. 6
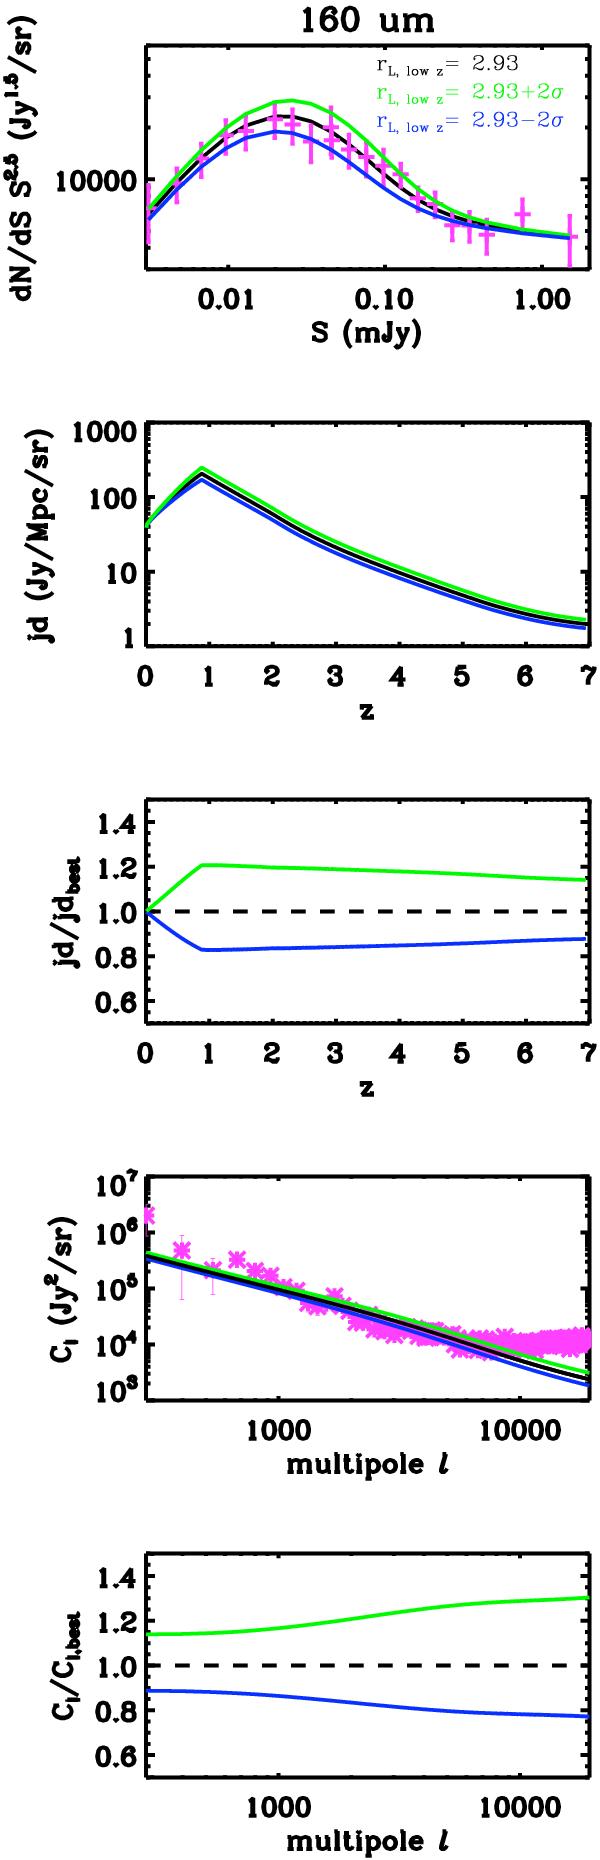
Counts at 160 μm, emissivities, and clustering power spectrum for three values of rL⋆, lz, the best fit, and the best fit ± 2σ. Pink crosses are data: Béthermin et al. (2010) for the counts and Lagache et al. (2007) for the power spectrum. Top panel: differential number counts at 160 μm. 2nd panel: mean emissivities at 160 μm. 3rd panel: ratio of the modified emissivities compared to the best fit one at 160 μm. 4th panel: power spectra of the clustering at 160 μm. Bottom panel: ratio of the modified power spectra compared to the best fit one at 160 μm. A small change in rL⋆, lz leads to a 20% modification of the emissivities and on 15–35% on the Cℓ.
Current usage metrics show cumulative count of Article Views (full-text article views including HTML views, PDF and ePub downloads, according to the available data) and Abstracts Views on Vision4Press platform.
Data correspond to usage on the plateform after 2015. The current usage metrics is available 48-96 hours after online publication and is updated daily on week days.
Initial download of the metrics may take a while.