Fig. 2
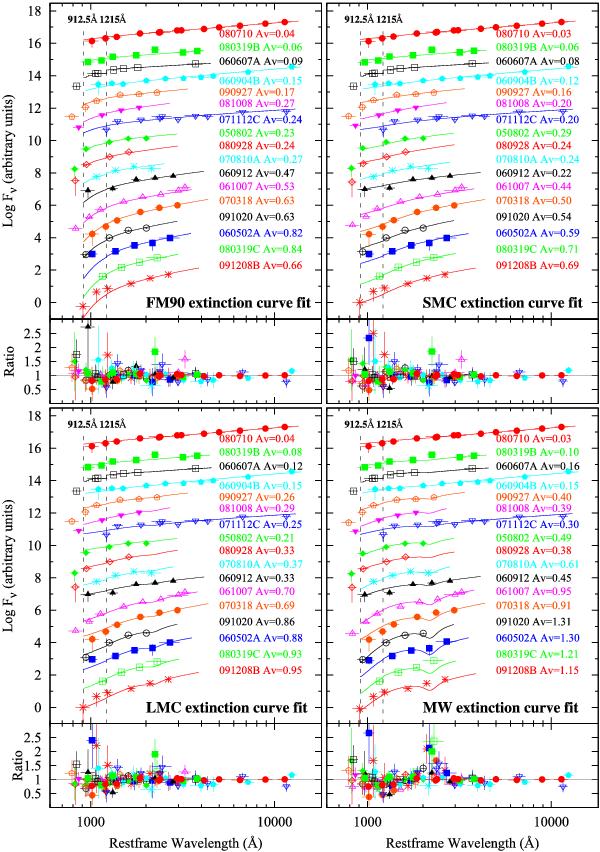
UV/optical/NIR afterglow SEDs of the 17 GRBs in our sample plotted in the rest-frame. Overplotted are the best-fit models from the simultaneous fits, where each of the four figures correspond to a different host galaxy extinction curve model fitted to the data. The four extinction curves fitted are our best-fit FM90 extinction curve (top left; best-fit coefficients given in Table 3), the mean SMC (top right), mean LMC (bottom left), and mean Milky Way (bottom right) extinction curves, where the latter three extinction curves use the parameterisation from Pei (1992). In all panels the y-axis is arbitrary and the afterglow SEDs are mostly ordered by afterglow host galaxy extinction with the most extinguished at the bottom, and the least plotted at the top. In all four panels the dashed lines indicate the Lyman-break at 912.5 Å, and the location at 1215 Å, blueward of which the Lyman-forest presents a further absorption component.
Current usage metrics show cumulative count of Article Views (full-text article views including HTML views, PDF and ePub downloads, according to the available data) and Abstracts Views on Vision4Press platform.
Data correspond to usage on the plateform after 2015. The current usage metrics is available 48-96 hours after online publication and is updated daily on week days.
Initial download of the metrics may take a while.