Free Access
Fig. 4
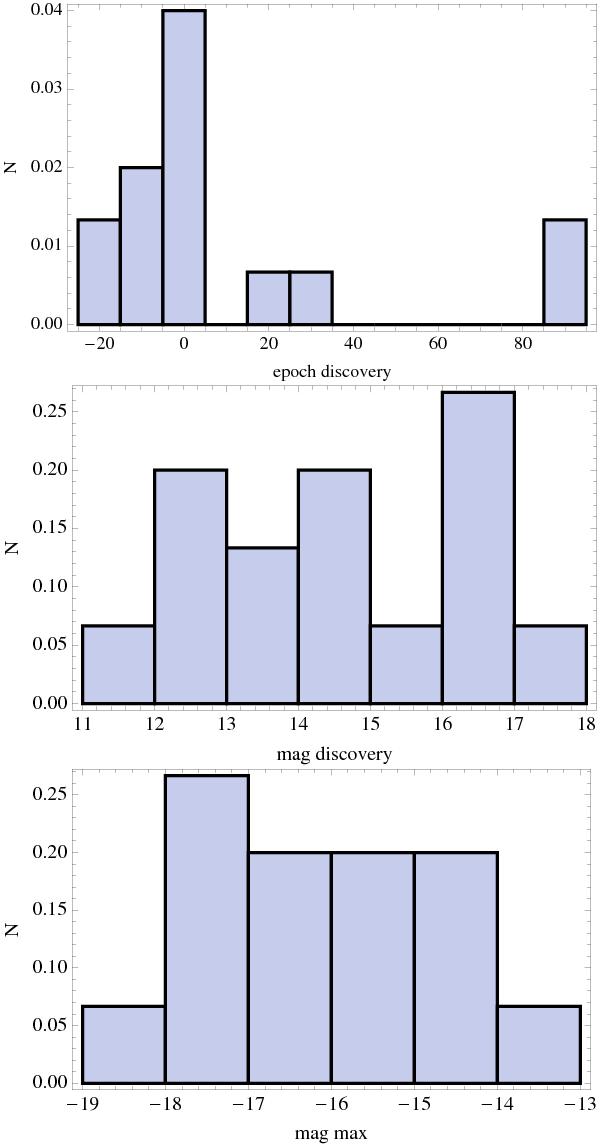
The distribution of the discovery epoch with respect to the maximum light, of the discovery magnitude and absolute magnitude at maximum for our SN sample. The values for each CC SN and sources are reported in Table 2.
This figure is made of several images, please see below:
Current usage metrics show cumulative count of Article Views (full-text article views including HTML views, PDF and ePub downloads, according to the available data) and Abstracts Views on Vision4Press platform.
Data correspond to usage on the plateform after 2015. The current usage metrics is available 48-96 hours after online publication and is updated daily on week days.
Initial download of the metrics may take a while.