Fig. 3
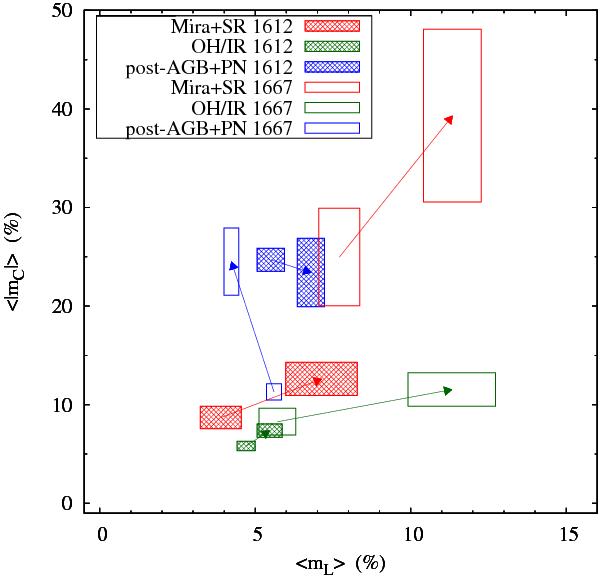
Comparison of the mean fractional polarizations obtained with two different methods (Tables 4 and 5). The mean values of mL and mC correspond to the rectangle centres and the standard deviations are marked by the borders. The origins of the arrows mark the mean fractional polarizations estimated at the Stokes I peaks, whereas the arrowheads mark the mean fractional polarizations estimated at the Stokes V and p peaks.
Current usage metrics show cumulative count of Article Views (full-text article views including HTML views, PDF and ePub downloads, according to the available data) and Abstracts Views on Vision4Press platform.
Data correspond to usage on the plateform after 2015. The current usage metrics is available 48-96 hours after online publication and is updated daily on week days.
Initial download of the metrics may take a while.