Fig. 3
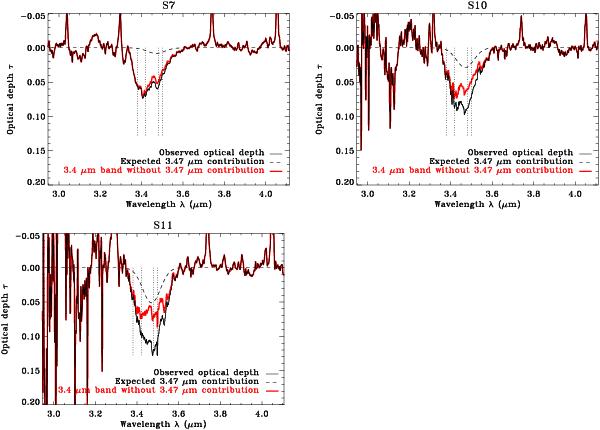
Recovered optical depth spectra of the 3.4 μm hydrocarbon band toward sources S7, S10, and S11. The black solid lines are the optical depths deduced from the observations and the associated continua presented in Fig. 2. The deduced underlying 3.47 μm bands (dashed lines) are shown by a Gaussian functions with 0.1 μm FWHM and a maximum depth estimated from the water ice optical depths (cf. Table 3 and text for details). The red thick solid lines are the subtractions of the dashed lines from the black solid lines and represent the 3.4 μm hydrocarbon features. The positions of the subpeaks corresponding to the C-H stretching modes in the 3.4 μm band are indicated by the vertical dotted lines (asymmetric stretch in the methyl and methylene groups at 3.38 and 3.42 μm, and symmetric stretch in the methyl and methylene groups at 3.48 and 3.50 μm, respectively).
Current usage metrics show cumulative count of Article Views (full-text article views including HTML views, PDF and ePub downloads, according to the available data) and Abstracts Views on Vision4Press platform.
Data correspond to usage on the plateform after 2015. The current usage metrics is available 48-96 hours after online publication and is updated daily on week days.
Initial download of the metrics may take a while.