Fig. 7
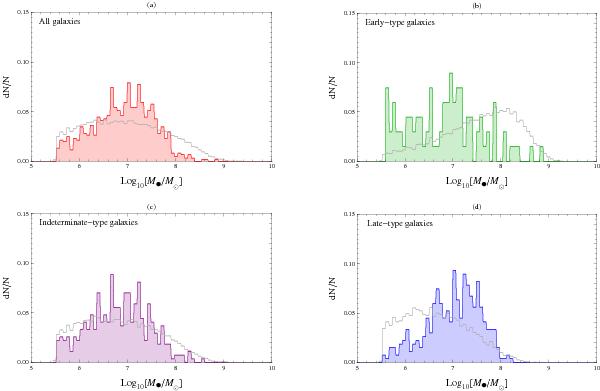
The distribution of SMBH masses for both normal (white) and AGN (colored) host galaxies as a function of morphology (Δ [log 10M• ] = 0.05 bin). The data of the galaxies have been extracted from the Sloan Digital Sky Survey in redshift interval 0.02 < z < 0.05. The masses have been inferred via the M• − σ relation using the slope and the normalization taken from Table 2. In order to compare our results with that of Schawinski et al. (2010), we plotted only objects where the measured velocity dispersion is greater than 40 km s-1.
Current usage metrics show cumulative count of Article Views (full-text article views including HTML views, PDF and ePub downloads, according to the available data) and Abstracts Views on Vision4Press platform.
Data correspond to usage on the plateform after 2015. The current usage metrics is available 48-96 hours after online publication and is updated daily on week days.
Initial download of the metrics may take a while.