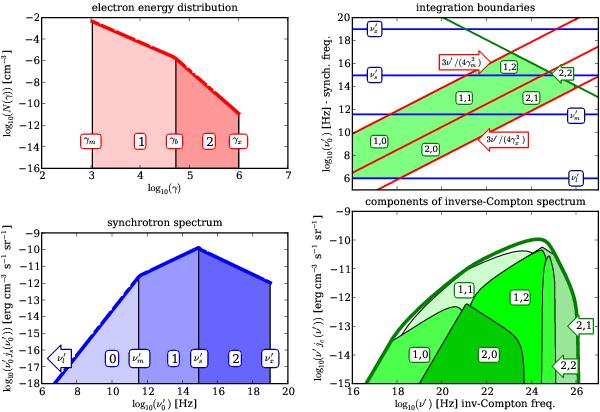
Fig. A.1

An example of an approximation of SSC emission. The figure shows a broken power-law (γb) electron spectrum with a low energy cut-off (γm) that extends up to some maximal energy (γx). This distribution generates synchrotron emission with two breaks ( ) and extends from some minimal (
 ) to some maximal frequency (
 ). The energy spectrum is divided into two parts, whereas the synchrotron radiation is divided into three parts. This provides six different components of the inverse-Compton emission. Each component must be integrated with different boundary conditions. The upper right panel demonstrates how to choose these conditions. This panel shows synchrotron frequencies as functions of the IC photon frequencies, where the horizontal lines indicate the characteristic frequencies in the synchrotron spectrum. Three slanted lines are calculated according to the well-know relation
  for the three characteristic particle energies (γm,γb,γx). The single opposite slanted line shows the Klein-Nishina restriction according to the approximation
  . The crossing lines produce six rectangle areas that indicate the lower and upper integration boundaries for each component. Each component of the IC emission is indicated by a pair of numbers where the first number refers to the part of the electron energy spectrum and the second number shows the part of the radiation field used to create this component.
Current usage metrics show cumulative count of Article Views (full-text article views including HTML views, PDF and ePub downloads, according to the available data) and Abstracts Views on Vision4Press platform.
Data correspond to usage on the plateform after 2015. The current usage metrics is available 48-96 hours after online publication and is updated daily on week days.
Initial download of the metrics may take a while.


