Fig. 1
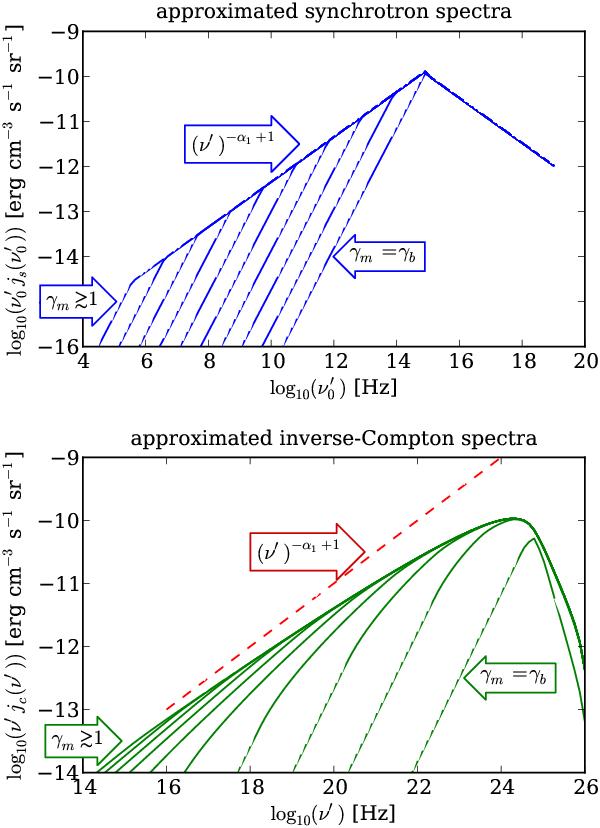
Approximate synchrotron and IC spectra calculated for different values of γm, from almost unity up to γb. This test demonstrates how the spectral index in the MeV − GeV range depends on the γm value. The dashed line shows the difference between the estimated (α1 = 0.5) and calculated (α ≃ 0.65) spectral slope below the peak.
Current usage metrics show cumulative count of Article Views (full-text article views including HTML views, PDF and ePub downloads, according to the available data) and Abstracts Views on Vision4Press platform.
Data correspond to usage on the plateform after 2015. The current usage metrics is available 48-96 hours after online publication and is updated daily on week days.
Initial download of the metrics may take a while.