Fig. 14
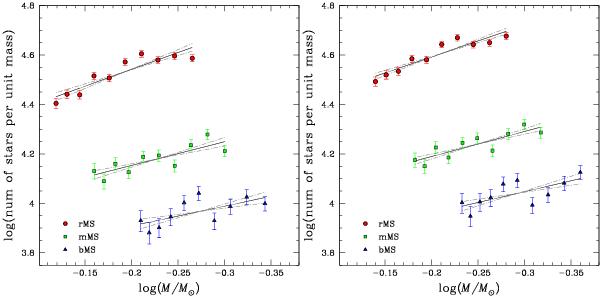
Mass function for the three MSs obtained by using the observed LFs of Fig. 12 and the mass-luminosity relations from Pietrinferni et al. (2004, left) and Dotter et al. (2007, right). Continuous black lines are the best-fit straight lines, while grey dotted-dash lines are the maximum- and minimum-slope lines. Note that star counts have been done in mass intervals, by dividing the numbers of stars estimated in luminosity bins by the respective bin widths in mass.
Current usage metrics show cumulative count of Article Views (full-text article views including HTML views, PDF and ePub downloads, according to the available data) and Abstracts Views on Vision4Press platform.
Data correspond to usage on the plateform after 2015. The current usage metrics is available 48-96 hours after online publication and is updated daily on week days.
Initial download of the metrics may take a while.