| Issue |
A&A
Volume 537, January 2012
|
|
|---|---|---|
| Article Number | A139 | |
| Number of page(s) | 12 | |
| Section | Interstellar and circumstellar matter | |
| DOI | https://doi.org/10.1051/0004-6361/201014754 | |
| Published online | 24 January 2012 | |
The imprint of a symbiotic binary progenitor on the properties of Kepler’s supernova remnant
1 Astronomical Institute, Utrecht University, PO Box 80 000, 3508 TA Utrecht, The Netherlands
e-mail: This email address is being protected from spambots. You need JavaScript enabled to view it.
2 Department of Physics, University of Oxford, Clarendon Laboratory, Parks Road, Oxford OX1 3PU, UK
3 Astronomical Institute “Anton Pannekoek”, University of Amsterdam, Science Park 904, 1098 XH Amsterdam, The Netherlands
Received: 8 April 2010
Accepted: 14 October 2011
Abstract
We present a model for the type Ia supernova remnant (SNR) of SN 1604, also known as Kepler’s SNR. We find that its main features can be explained by a progenitor model of a symbiotic binary consisting of a white dwarf and an AGB donor star with an initial mass of 4−5 M⊙. The slow, nitrogen-rich wind emanating from the donor star has partially been accreted by the white dwarf, but has also created a circumstellar bubble. On the basis of observational evidence, we assume that the system moves with a velocity of 250 km s-1. Owing to the spatial velocity, the interaction between the wind and the interstellar medium has resulted in the formation of a bow shock, which can explain the presence of a one-sided, nitrogen-rich shell. We present two-dimensional hydrodynamical simulations of both the shell formation and the SNR evolution. The SNR simulations show good agreement with the observed kinematic and morphological properties of Kepler’s SNR. In particular, the model reproduces the observed expansion parameters (m = V/(R/t)) of m ≈ 0.35 in the north and m ≈ 0.6 in the south of Kepler’s SNR. We discuss the variations among our hydrodynamical simulations in light of the observations, and show that part of the blast wave may have completely traversed through the one-sided shell. The simulations suggest a distance to Kepler’s SNR of 6 kpc, or otherwise imply that SN 1604 was a sub-energetic type Ia explosion. Finally, we discuss the possible implications of our model for type Ia supernovae and their remnants in general.
Key words: ISM: supernova remnants / hydrodynamics / binaries: symbiotic / supernovae: individual: SN1604
© ESO, 2012
1. Introduction
Type Ia supernovae (SNe Ia) are of prime interest for many areas in astrophysics. They are important cosmological standard candles, because of their high, well-calibrated (Phillips et al. 1992) peak luminosities. The study of SNe Ia has led to the realization that we appear to live in a Universe whose expansion is accelerating (Perlmutter et al. 1998; Garnavich et al. 1998). In addition, SNe Ia are major contributors to the chemical enrichment of the Universe, as they are the principal source of iron peak elements.
There is a consensus that SNe Ia are the result of thermonuclear explosions of CO white dwarfs (WDs) in binary systems that approach the Chandrasekhar mass by means of either accretion from a companion star (single degenerate scenario) or the merging of two WDs (double degenerate scenario) (see the reviews by Hillebrandt & Niemeyer 2000; Livio 2000). The double degenerate (DD) scenario is more consistent with stellar population synthesis models (e.g. Yungelson & Livio 2000; Ruiter et al. 2009; Claeys et al. 2010), but the explosion mechanism itself is far from clear. The main problem is that WD mergers lead to an off-center ignition that converts carbon and oxygen into oxygen, neon and magnesium. This results in an accretion-induced collapse and the formation of a neutron star, rather than a thermonuclear explosion (Saio & Nomoto 1985; Nomoto & Kondo 1991, although see Pakmor et al. 2010).
For the single degenerate (SD) scenario, the greatest problem remains to establish the nature of the progenitor binary systems. To reach the Chandrasekhar limit, the WD should accrete and burn the material from its companion star at a rate of around 10-7 M⊙ yr-1 (Nomoto 1982). For lower accretion rates, the accumulated material is liable to undergo unstable burning, giving rise to nova explosions that expel more mass than is accreted. On the other hand, high accretion rates lead to the expansion of the WD’s photosphere to red giant dimensions and, in the absence of the stabilizing effects of strong accretion winds (Hachisu et al. 1996, 1999), the system will undergo a common envelope episode, which does not lead to a SD SNe Ia (Iben & Tutukov 1984). The finetuning needed to create a SN Ia explosion is in sharp contrast to the relatively high probability of ~15% for stars in the 3–8 M⊙ range to eventually explode as SN Ia (e.g. Mannucci et al. 2006; de Plaa et al. 2007; Maoz 2008).
Our understanding of SN Ia would improve substantially if we would identify progenitor systems directly or indirectly by means of the imprints they have on the SN spectra, or the supernova remnants (SNRs). Several studies have been conducted along these lines, which reach different conclusions about the origin of the SNe Ia. On the one hand, an increasing number of type Ia SN and SNRs show evidence of interaction with the circumstellar medium (CSM) (e.g. Sternberg et al. 2011; Patat et al. 2007; Borkowski et al. 2006), which is most consistent with a SD scenario and a non-conservative mass transfer history of the binary progenitor. On the other hand, the Hα, radio, UV, and X-ray observations of several SN Ia place constraints on the outflows around type Ia progenitors and the size of the donor star (e.g. Mattila et al. 2005; Panagia et al. 2006; Hughes et al. 2007; Tucker 2011).
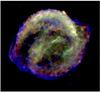 |
Fig. 1 Chandra X-ray image of Kepler’s SNR, with red indicating Si-Kα emission (1.75–1.95 keV), green Fe-L emission (0.8–1.6 keV), and blue continuum emission (4–6 keV). The image is based on a deep, 750 ks, Chandra observation (Reynolds et al. 2007). |
In this paper, we investigate the origin of the remarkable structure of the CSM shaping Kepler’s SNR (hereafter Kepler), the remnant of the historical SN 1604 (Green & Stephenson 2003; Blair et al. 2007). As we discuss below, SN 1604 was very likely a SN Ia and the CSM observed in the evolved SNR places constraints on the type of progenitor of this SNR.
Kepler (G4.5+6.8) is located relatively high above the Galactic plane, at 590d5 pc, where d5 is the distance in units of 5 kpc. Its radius is 2.6d5 pc. The distance itself is not well-known. Reynoso & Goss (1999) used the HI absorption feature to place a lower limit of (4.8 ± 1.4) kpc and independently determined an upper limit of 6.4 kpc based on the lack of absorption by an HI cloud. Sankrit et al. (2005) combined an estimate of the shock speed based on the Hα line width with a proper motion measurement to derive a distance of  kpc. Although these distance measurements agree with each other within the errors, the lack of a detection of Kepler in TeV gamma-rays by H.E.S.S. (Aharonian et al. 2008), coupled with gamma-ray model predictions (Berezhko et al. 2006) and the energetics of the SNR based on expansion measurements (Vink 2008), suggest a distance ≳ 6 kpc, or otherwise a subenergetic explosion.
The SNR displays a bright optical nebulosity with prominent [NII] line emission in the north, indicating dense material with elevated nitrogen abundances, [N] / [N] ⊙ > 2, but otherwise roughly solar metallicity (Blair et al. 1991; Reynolds et al. 2007). The radio (Dickel et al. 1988) and X-ray expansion measurements (Vink 2008; Katsuda et al. 2008) of the SNR indicate an overall expansion parameter m = V/(R/t) ≈ 0.6, where V is the plasma or shock velocity, R the corresponding radius, and t the age of the SNR. An exception is the northern region, where the expansion parameter is m ≈ 0.35, which is lower than expected for the Sedov-Taylor phase in a homogeneous medium (m = 0.4). On the basis of these results, Vink (2008) estimates that the nitrogen-rich shell must have had a mass of at least 1 M⊙ (see also Blair et al. 2007).
The presence of the nitrogen-rich shell has puzzled astronomers for a long time and has led to the claim that SN 1604 was a type Ib SN (Bandiera 1987), where the northern shell of Kepler represented the shedded outer envelope of the progenitor. To explain its height above the Galactic plane, the one-sided morphology of the shell, and the high proper motion of the nitrogen-rich knots, Bandiera (1987) argued that the progenitor had a high proper motion of ~280 km s-1. This model formed the basis of the hydrodynamical simulations of Borkowski et al. (1992). This high spatial velocity of Kepler’s progenitor was verified observationally based on the proper motion and radial velocities of the nitrogen-rich knots of the remnant (Bandiera & van den Bergh 1991) and the Hα narrow component of the non-radiative shocks of the SNR, which both imply that u∗ ≈ 250 km s-1 (Blair et al. 1991; Sollerman et al. 2003).
Since the late nineties, it has become clear that SN 1604 was probably not a type Ib, but a SN Ia. The main reason for this is that its X-ray spectrum displays prominent Fe-L emission (about 0.2–0.6 M⊙; Kinugasa & Tsunemi 1999) and relatively little oxygen emission (Reynolds et al. 2007), which are both characteristic of type Ia SNRs (Hughes et al. 1995). Supporting evidence of a type Ia identification is the presence of Balmer-dominated shocks and the absence of an X-ray emitting, cooling, neutron star (Reynolds et al. 2007). This means that the dense circumstellar nitrogen-rich shell must originate from the progenitor system of the SN Ia. Velázquez et al. (2006) extended the hydrodynamical model of Borkowski et al. (1992), by considering both core collapse and type Ia origins. They found that the best agreement with the observations was reached for models that correspond to a type Ia event. Their choice of mass-loss parameters and the origin of the shell, however, were not based on a physical model for the progenitor system. For example, their total integrated mass-loss for the type Ia cases was 7.5 M⊙, which exceeds the mass of a likely type Ia donor star.
Here, we demonstrate that the characteristics of Kepler can best be explained within the framework of a single degenerate SN Ia model, assuming non-conservative mass transfer by means of wind accretion from a 4–5 M⊙ asymptotic giant branch (AGB) star. We retain in this model the idea that the northern shell is the result of a bow shock caused by the motion of the progenitor system (Bandiera 1987; Borkowski et al. 1992), and we adopt the observed spatial velocity of 250 km s-1. We demonstrate using hydrodynamical simulations that this model can account for the morphology of the SNR and its expansion characteristics.
In Sect. 2, we discuss the progenitor binary system and in Sect. 3 we determine its implications for the properties of the interstellar medium (ISM) and the evolution of the circumstellar medium and SNR. In Sect. 4, we model the system using hydrodynamic simulations with the appropriate parameters and discuss the differences when varying the exact parameters. We evaluate the results of our simulations and our progenitor model in a broader context in Sect. 5 and end with our conclusions in Sect. 6.
2. A type Ia progenitor scenario for SN 1604
Any model of Kepler’s progenitor system should explain the formation of a ≥ 1 M⊙ asymmetric shell of solar metallicity and enhanced nitrogen abundances, which lies at the northern region of the remnant at a distance of 2–3 pc from the explosion center.
This shell might have been formed by i) substantial outflows from the WD’s surface, such as nova explosions or “accretion winds”; ii) the wind of the WD progenitor star (i.e. the SNR interacts with a planetary nebula-like shell); iii) the wind of the donor star; or iv) the ejected common envelope, in the case of a DD progenitor scenario.
The nova explosions related to SNe Ia are the recurrent novae that occur on the surface of massive WDs ( ≥ 1.2 M⊙) in the final phase of binary evolution (Hachisu & Kato 2001; Hachisu et al. 2008). However, during the recurrent novae phase, the total mass that is ejected from the WD surface is on the order of 10-3−10-2 M⊙ (Hachisu et al. 2008). Given that recurrent nova ejecta have abundances similar to solar (see Livio & Truran 1992, for summary), they are not able to accumulate enough heavy elements into the CSM shell to reproduce the observed chemical abundances. On the other hand, an outflow in the form of an accretion wind emanating from the WD surface is so fast (uwind ~ 1000 km s-1) that it would form a large low-density cavity around the progenitor system. Badenes et al. (2007) showed that these cavities are at odds with the observed radii, shock velocities, and ionization timescales of Galactic, LMC, and M 31 type Ia SNRs (including Kepler). Our hydrodynamical simulation of a SNR evolution in a cavity formed by accretion winds verifies their results.
Case ii can be excluded because of the length of the timescales involved. The time interval between the planetary nebula phase and the type Ia explosion should be at least ~106 yr, since the WD needs to accrete at least 0.2–0.4 M⊙(see the review by Weidemann 2000) at a rate of 10-7M⊙ yr-1. During this period, the formed shell would have collapsed under the ram pressure of the interstellar medium as the binary system moves with a velocity of 250 km s-1. The same line of argumentation can be applied to case iv, since, after the ejection of the common envelope the merging timescale of the two WDs is at least 0.1 Myr (Claeys 2011, priv. comm.). Although this scenario seems unlikely, the lack of understanding of the ejection of a common envelope and the subsequent evolution (e.g. Taam & Ricker 2010) prevents us from drawing a definitive conclusion about the likelihood of case iv as a progenitor scenario.
Therefore, the wind from the donor star (case iii) appears to be the most likely origin of this circumstellar shell as the wind velocities of evolved stars are much smaller than those of the WD’s outflows, resulting in smaller and denser cavities, and their formation continues until the moment of the explosion.
2.1. The case for a symbiotic binary
Nitrogen-rich stellar winds can emanate from the surfaces of evolved stars, which are either on the first giant branch (FGB) or on the asymptotic giant branch (AGB). This suggests that the progenitor system of Kepler’s SN was a symbiotic binary consisting of a giant star and a CO WD.
Among these two evolutionary stages of either FGB or AGB donor star, the latter seems the more suitable for the formation of the observed shell. The AGB stars are characterized by much stronger stellar winds than FGB stars, and are able to eject >1 M⊙ at a distance of 2–3 pc (see Sect. 3.1). In addition, even if the FGB stars are able to enrich their surfaces with nitrogen during the first dedge-up, the amount of nitrogen is always limited by their initial metallicity, as they have not yet produced carbon. It is, therefore, difficult to explain the nitrogen overabundance that is observed in the northern shell. In contrast, the most massive AGB stars (M > 4 M⊙, depending on the metallicity) can enrich their surfaces with copious amounts of nitrogen by means of the hot bottom burning (HBB) process. HBB converts 12C into 14N and if the third dredge-up occurs, the star becomes nitrogen rich (N/C > 1). On the basis of the results of Karakas & Lattanzio (2007), the chemical composition of the shell can most accurately be reproduced by an AGB donor star of 4 − 5 M⊙ with solar metallicity (see Table 1).
The production factor and the chemical abundances as a function of the stellar (initial) mass of an AGB star of solar metallicity (Karakas & Lattanzio 2007).
2.2. The mass transfer process
Efficient mass accumulation on the WD requires stable mass transfer. Roche-lobe overflow (RLOF) from stars with deep convective envelopes, such as the AGB star considered here, leads to dynamical unstable mass transfer and the formation of a common envelope. Such a system does not evolve towards a SD type Ia SN. Thus, the progenitor system was most likely a wide symbiotic binary, for which the AGB star remained within its Roche lobe. This implies that the orbital radius was larger than ~1600 R⊙ for typical mass ratios.
The accretion process should take place through non-conservative mass transfer, where a part of the wind is trapped by the WD, while the remainder is ejected from the system forming the circumstellar shell.
However, the HBB process takes place during the thermal pulsating AGB phase where the wind reaches the maximum mass-loss rate of a few 10-5 M⊙ yr-1. Since the stable accretion rate at the WD surface is on the order of 10-7 M⊙ yr-1, the accretion efficiency has to be ~1%. If this efficiency were representative of the average accretion rate, an insufficient amount of mass would be transferred to the WD during the evolution. Thus, a more efficient mass-transfer period must have occurred during an earlier evolutionary stage of the donor. This mass transfer process might have been either pure wind accretion or a more efficient process, such as the tidally enhanced wind accretion (Chen et al. 2011) or the wind-RLOF accretion (Mohamed & Podsiadlowski 2007). In any case, since the WD needs to accrete at least 0.2–0.4 M⊙ to approach the Chandrasekhar mass and the envelope mass of the AGB is ~3–4 M⊙, an average accretion efficiency of ≥ 5–10% is required during the binary evolution.
2.3. The bow-shock formation and the spatial velocity
The high spatial velocity of Kepler’s SNR of 250 km s-1implies that Kepler originates from a runaway star that was ejected from the Galactic center/disk. The asymmetric accumulation of the circumstellar shell at Kepler’s SNR can be readily explained by this supersonic motion away from the Galactic plane. The interaction of the wind with the ram pressure of the interstellar medium has caused the formation of a bow-shaped shell. The subsequent supernova has produced a blast wave that currently interacts with the nearest part of this shell.
However, since SN 1604 was likely a SN Ia event, the progenitor must have been part of a binary system. This implies that the progenitor must have been a rather rare type of object, because runaway stars are usually single stars. Theoretical predictions based on binary-binary collisions, indicate that 10% of the runaway stars are binaries (e.g. Leonard & Duncan 1990), in agreement with observational studies (Gies & Bolton 1986; Martin 2006; McSwain et al. 2007a,b). Moreover, the creation of a runaway star or binary system is expected to take place early in the life of the stars, when they are still part of a dense star cluster. Comparing the relatively short time travel time for Kepler’s progenitor to reach its current position above the Galactic plane, ~3 × 10⁶ yr, with the typical timescale for a white dwarf to form (≳30 × 106 yr), or for a 4–5 M⊙ donor star to reach the AGB phase ( ≳ 100 × 106 yr), shows that the runaway system must have been created late in the life of the progenitor star. However, we point out that observationally it is found that many runaway stars seem to have lifetimes that are substantially longer than their travel timescales (see Fig. 7 of Martin 2006).
3. Formation and evolution of the wind bubble and the subsequent SNR
After outlining the properties of the progenitor binary system, we can now study the formation and evolution of the wind bubble and the subsequent interaction of the SNR with it. We consider the wind and SNR dynamics analytically and introduce the range of variables in our model.
3.1. The formation of the wind bubble and the bow shock model
The properties of a supersonically moving wind bubble that interacts with the ISM, is a function of four variables; the mass loss rate, Ṁ, the wind velocity uw, the spatial velocity, u∗, and the ISM density, nism. The system is in a steady state when the timescale of the interaction process between the wind and the ISM is longer than the flow timescale defined as 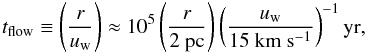 (1)where r in this case indicates the distance of the bow shock from the mass-losing star.
In a steady state, the position of the bow-shock shell is determined by the balance of the stellar wind and the ISM ram pressure. At the so-called stagnation point, the wind termination shock is at its shortest distance, r0, from the mass losing star. Equating the momentum fluxes of the ISM to those of the CSM, this can be estimated to be around 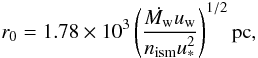 (2)when the velocities are measured in km s-1, Ṁw in M⊙ yr-1, and nism in cm-3 (Huang & Weigert 1982).
In Sect. 2, we argued that the donor star of the progenitor system was a 4 − 5 M⊙ AGB star. These stars are characterized by dense, slow, radiation-driven stellar winds with typical terminal velocities of 5 − 20 km s-1 and temperatures of 1000 − 2000 K (Habing & Olofsson 2003). The mass loss rates fluctuate across a wide range, starting from 10-8 − 10-6 M⊙ yr-1 during the early AGB phase to 10-6 − 10-5 M⊙ yr-1 at the thermal pulsating AGB phase (Vassiliadis & Wood 1993; Karakas & Lattanzio 2007). The total duration of the AGB phase is on the order of 1 Myr. Assuming typical wind-loss parameters appropriate for the thermal pulsating AGB phase, a steady state situation is reached after tflow ≈ 0.1 − 0.3 Myr for r0 = 2 pc and tflow ≈ 0.1 − 0.4 Myr for r0 = 3 pc (Eq. (1)), which is well within the limits of the lifetime of an AGB star.
To reproduce the radius of the stagnation point, we also need to estimate the ISM density. We do not have a priori estimates of this density, as there are no clear observational indications of its properties in Kepler’s neighborhood. Both the neutral/ionized warm and the hot ionized component extend to the latitude of Kepler (Reynolds 1991). However, the constraint on the distance of the stagnation point (r0 ≊ 2 − 3 pc, see Eq. (2)) implies that nism ≤ 10-3 cm-3. This value is characteristic of the hot ionized component (T ≈ 106 K), where nism ~ 10-4 − 10-3 cm-3 (McKee & Ostriker 1977), and was also used by Borkowski et al. (1992) based on the observed densities of the wind shell (nshell ≈ 1 − 10 cm-3, Smith et al. 1989; Blair et al. 1991).
Figure 2 shows the possible combinations of Ṁw and uw that result in r0 = 2 pc for the lower distance estimate of Kepler, and r0 = 3 pc for the larger distance estimate. In this plot, we have adopted nism = 0.5 × 10⁻³ cm-3 for the hot ionized ISM, and u∗ = 250 km s-1.
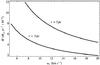 |
Fig. 2 The mass loss rates versus the wind velocity of the AGB star for values satisfying r0 = 2 pc and r0 = 3 pc for nism = 0.5 × 10⁻³ cm-3 and u∗ = 250 km s-1. |
3.2. Supernova properties and evolution
The canonical values of the mass and energy of type Ia SNe are Mej = 1.4 M⊙ and Eej = 1051 erg (Woosley et al. 2007), respectively. We apply the self-similar solution of Chevalier (1982) describing how a SNR expands into an ρ ∝ r-2 wind profile, to our model corresponding to the regions interior to the shell. The ejecta is assumed to consist of a constant density core with an envelope that follows a ρ ∝ r-7 density profile, while the velocity in the ejecta increases linearly. By assuming energy conservation, the expansion of the ejecta in a wind bubble with ρwind = qr − s, where s = 2 and  is given by
 ![Mathematical equation: \begin{equation} \label{eq:rblast} R_{\rm snr} = 1.3\times[A g^n/q]^{1/(n-s)}t^{\left(n-3)/(n-s\right)}, \end{equation}](/articles/aa/full_html/2012/01/aa14754-10/aa14754-10-eq104.png) (3)where A is a constant equal to 0.27, and t is the age of the remnant (in s). Finally, g is a constant given by
(3)where A is a constant equal to 0.27, and t is the age of the remnant (in s). Finally, g is a constant given by
 Given the age of Kepler’s SNR t ≈ 400 yr, and using mass-loss parameters of
  , and uw = 10 − 20 km s-1, we find that Rsnr = 3.0 − 4.7 pc. These values of the SNR radius correspond to a distance of Kepler of around d = 6.2 − 9.7 kpc. To obtain a SNR radius consistent with a distance of d = 4 kpc, we also have to consider a subenergetic explosion of E = 0.2 × 1051 erg. In that case, we obtain Rsnr = 1.6 − 2.4 pc and d = 3.3 − 4.9 kpc.
4. Hydrodynamic modeling
We employ the hydrodynamic code of the AMRVAC framework (Keppens et al. 2003) to simulate the circumstellar bubble around Kepler’s progenitor system and the subsequent evolution of the supernova ejecta. We perform the calculations on a 2D grid in spherical coordinates and assume symmetry in the third dimension. The Euler equations are solved conservatively with a TVDLF scheme, using the adaptive mesh strategy to refine the grid where needed as a result of large gradients in density and/or energy. Our radial span is 2 × 1019 cm and the range of the polar angle is from 0° to 180°. On the base level, we use 240 × 120 cells (R × θ) and allow for three refinement levels during wind evolution and four for the SNR evolution, at each of which the resolution is doubled. The maximum effective resolution, thus, becomes 1.04 × 1016 cm by 0.188°. Radiative cooling is prescribed using the cooling curve of Schure et al. (2009).
We first simulate the formation of the CSM bubble with the ISM bow shock shell. We model the system in the rest frame of the progenitor system and model the ISM interaction as an inflow. The ISM of density ρi enters the grid antiparallel to the y-axis and with a momentum mr = ρiu∗cosθ (see Fig. 3). Thus, the symmetry axis is aligned with the systemic direction of motion, roughly corresponding to the northern region of Kepler’s SNR. In the inner radial boundary, we impose an inflow in the form of a cold, slow, stellar wind with a density profile of ρ = Ṁw/(4πr2uw) and momentum mr = ρuw and mθ = 0. In the second stage, we introduce the supernova ejecta into the wind bubble and allow the SNR to evolve.
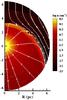 |
Fig. 3 The 2D density profile of the simulation of the bow-shocked wind bubble. The mass-losing star is located in the origin where we allow a radial wind flow to enter the grid. Isotropic, homogeneous gas simultaneously enters the grid antiparallel to the y-axis, which represents the motion of the ISM in the star’s rest frame. The arrows correspond to the vectors of the momentum of each flow. |
In Sect. 3, we defined the constraints on the spatial velocity, mass-loss rate, and wind velocity. These constraints allow some variation in these parameters, which all infer roughly similar values for the radius of the shell, but which may nevertheless influence the properties of the SNR. To investigate this, we performed several hydrodynamical simulations, varying the wind parameters and spatial velocity. In addition, as there is some uncertainty in the distance to Kepler, we study the cases where the stagnation point is placed at ~2 pc and ~3 pc from the explosion center, corresponding to the SNR distances of 4 kpc and 6 kpc, respectively. The grid of models is summarized in Table 2.
The properties of the five studied models.
 |
Fig. 4 The evolution of the wind bubble of model A. The snapshots from left to right correspond to the times 0.10 Myr, 0.29 Myr, 0.38 Myr, and 0.57 Myr. |
 |
Fig. 5 SNR evolution of model A. The snapshots from left to right correspond to the times 158 yr, 285 yr, 349 yr, and 412 yr. |
4.1. Wind bubble evolution
Figure 4 illustrates the evolution of the pre-supernova wind bubble using model A (see Table 2). It shows the typical four-zone structure of a stellar wind bubble, consisting, from inside out, of the freely streaming wind with ρ ∝ r-2, the shell of shocked stellar wind, the shell of shocked ISM, and the unperturbed interstellar gas. At the border of each ‘zone’ a density jump occurs that is caused by the termination shock, the contact discontinuity, and the outer shock. The shear flow at the interface of the two fluids is susceptible to the Kelvin-Helmholtz instability, which produces a wavy structure of the contact discontinuity.
The wind termination shock initially propagates rapidly outwards, but then decelerates, until it is stabilized, due to the momentum equilibrium between the wind and the ISM. This equilibrium is first achieved at the stagnation point, and then propagates to larger azimuthal angles.
We introduce the SN explosion once the stagnation point is at 2–3 pc, while taking care to ensure that the mass lost by the donor star is less than the mass of the envelope of the AGB star and the duration is shorter than the lifetime of an AGB phase. In model A, we find that these conditions are met at a time t = 0.38 Myr after initializing the evolution of the bubble. The stagnation point in this case is located at a distance of ~2.7 pc, the outer shock is at a distance of 5.2 pc, and the donor’s mass loss is equal to Ṁt = 3.8 M⊙.
 |
Fig. 6 Model A SNR properties at 412 yr. From left to right: density, expansion parameter, pressure, and temperature. |
4.2. SNR evolution
Figure 5 shows the evolution of the SNR for model A in an ambient medium that corresponds to the wind bubble at time t = 0.38 Myr. Initially, the SNR evolves in a spherically symmetric, freely expanding, wind-blown bubble (left panel). The freely streaming ejecta, shocked ejecta, contact discontinuity, and the shell of the shocked CSM can be distinguished. Rayleigh-Taylor instabilities develop at the contact discontinuity between the ejecta and the shocked CSM. The thin black lines outline the interaction regions between the ejecta and the CSM, while the white ones indicate the interface between the CSM and the ISM. Around ~285 yr after the explosion (second panel), the blast wave starts to interact with the shocked stellar wind of the circumstellar shell in the area of the stagnation point. The blast wave sweeps up the dense shell’s material and the deceleration in this area is therefore stronger, something that breaks the spherical symmetry of the SNR.
With time, a larger portion of the SNR starts to interact with the circumstellar shell. In the snapshot that corresponds to the age of Kepler’s SNR (t = 412 yr, right panel in Fig. 5), more than one third of the remnant interacts with the wind shell. Around the stagnation point, the blast wave has slightly penetrated the shell. At this moment, the blast wave in the southern region is located at a distance of Rblast ≈ 3.6 pc, and the contact discontinuity lies at Rcd ≈ 2.7 pc. The highest densities are found in the area around the stagnation point, where it reaches values of n ≈ 4.0 cm-3. This area is expected to have the highest emissivity.
Figure 6 shows the density, expansion parameter, pressure, and temperature of the simulated SNR at the age of Kepler. The expansion parameter, as expected, is much lower in the region where the interaction with the circumstellar shell takes place. Around the stagnation point, we find values as low as ~0.35, while for the non-interacting areas, the expansion parameter is 0.6. These values correspond to the expansion parameter of the plasma and are consistent with results from X-ray observations. The third panel shows the pressure, which clearly marks that the shocked plasma is rather homogeneous in the entire SNR, in agreement with the expectation of pressure equilibrium between the shocks. The stronger interaction in the region around the stagnation point causes the SNR to be thinner and to have higher pressure than the rest of the remnant. The temperature plot (right panel) is limited to the range log T = 6.0 − 9.5, corresponding only to the shock-heated SNR shell. Note that X-ray observations usually provide electron temperatures, which may be lower than the overall plasma temperatures depicted here owing to the non-equilibration of ions and electrons.
Figure 7 shows the position and the velocity of the blast wave (upper plot) and its expansion parameter (lower plot) for two different azimuthal angles of θ = 0° and θ = 180°. During the evolution of the SNR in the freely-expanding wind region, these three quantities are identical for the two angles. After 300 yr, the collision with the shell starts and at the interacting region (θ = 0°) the shock wave is strongly decelerated, while the SNR becomes slightly aspherical. The expansion parameter is ~0.8 for the areas that are still within the unshocked-wind region, while for θ = 0° it drops to ~0.5 for the SNR at Kepler’s age.
4.3. Comparison of the different models
We now evaluate differences in the morphology of the SNR by varying the mass loss properties and the spatial velocity of the system, as summarized in Table 2.
4.3.1. Concerning the wind bubble formation
In Fig. 8, we show the densities of the bubbles for the different models, at the moment immediately prior to the SN explosion. The left panel shows model A, which was described in Sect. 4.1.
In model B, we use a slightly lower mass-loss rate for the formation of the wind bubble. Owing to the longer duration of the shell formation, the Kelvin-Helmoltz instability at the contact discontinuity has developed more prominently. The chosen wind velocity is slightly higher, while the ISM density is lower to ensure that the stagnation point is at a distance of ~3 pc. The wind termination shock and the contact discontinuity are farther from the star than in model A. This model was considered to retain the blast wave of the SNR within the shocked wind shell at the current age of Kepler.
For model C, we use an even lower mass-loss rate and velocity of the AGB wind. These values provide a closer fit to the Reimers model for AGB mass-loss parameters (Reimers 1975), or an AGB at the early phase, according to the Vassiliadis & Wood (1993) description. To keep the stagnation point at a distance of 3 pc, the spatial velocity and the interstellar medium density were decreased from the values of the previous models. We consider a longer duration of the shell formation/mass transfer phase than in models A and B to accumulate enough mass and let the shell evolve to a distance of ~3 pc. The lower mass-loss rates and wind velocities yield a lower momentum in the wind material, resulting in a weaker interaction and thus a thicker and comparatively more tenuous shell.
The final panel shows the bubble for the model D. The wind mass-loss rate and duration of the shell formation are similar to those of model B. However, a lower wind velocity and a higher ISM density is applied. This causes the shell to be closer to the binary and denser. This shell model was considered in order to be able to include a case where Kepler is located at a distance of 4 − 5 kpc, for which we need the shell at a radial distance of 2.0 − 2.6 pc.
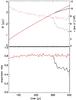 |
Fig. 7 Model A blast wave properties. The upper plot shows the position (solid lines) and the velocity (dotted lines) of the shock versus the time. The lower plot displays the evolution of the expansion parameter. The black color (lower lines) corresponds to the azimuthal angle of 0°, while the red (upper lines) represents 180°. |
4.3.2. The SNR evolution
The location, density, thickness and radius of curvature of the shell all determine the morphology of the SNR upon interaction with the ejecta. Figure 9 shows the resulting densities and expansion parameters of the SNR at an age of 412 yr, which is similar to the current age of Kepler.
As we noted in Sect. 4.2, in model A the SNR blast wave reaches slightly beyond the shell in the region around the stagnation point, and accelerates again as it protrudes. The expansion parameter of the plasma in the interaction region is consistent with the observed values and it reaches a minimum (~0.33) just behind the blast wave. This region is characterized by the highest densities, thus the emissivity is also expected to be relatively high.
Apart from the protrusion through the shell, model B yields similar properties. At the snapshot, which corresponds to the current age of Kepler, almost one third of the remnant interacts with the wind shell. The radius of the SNR is larger (4 pc compared to 3.8 pc in model A), and the minimum expansion parameter is slightly higher due to the lower densities of the wind region and wind shell, respectively.
These effects are even stronger for the case of model C. Owing to the much lower mass loss rates, the radius of the remnant is 4.1 pc, while the minimum expansion parameters tend to the value of 0.4. However, a similar morphology with the other two models was also found in this case.
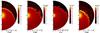 |
Fig. 8 Comparison of the four models of the wind shells. The plots from left to right correspond to model A, B, C, and D (the bubble for model Dsub is the same as the one for model D). |
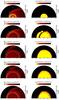 |
Fig. 9 Comparison of the density and the expansion parameter of the five models, from left to right corresponding to: A, B, C, D, and Dsub. The upper row shows the density of the remnant. The lower panels show the expansion parameter. |
In model D, the asymmetry is the highest. The interaction is strong because of the proximity and higher mass of the wind bubble, which was designed to accommodate the small distance estimate of 4 kpc to Kepler. The blast wave reaches well beyond the extent of the shell resulting in a high expansion parameter (≥0.7) in that area. This, together with the high degree of asymmetry, makes this model inconsistent with the observations of Kepler.
In all of these models, the radius of the SNR is fairly consistent with the larger distance estimate (~6 kpc) of Kepler. For a distance of 4 kpc we need a sub-energetic explosion to explain the observed morphology. We adopt the parameters of model D for the bubble, so as to have a wind shell relatively close to the star, while decreasing the explosion energy to one fifth of the canonical value in model Dsub. The radius of the SNR then becomes ~2 pc, and the asymmetry and expansion parameters are consistent with Kepler.
From these models, it is clear that the morphology does not depend on the fine-tuning of the parameters. For a reasonable range of values for all of the parameters, the expansion parameter, size, density, and morphology of Kepler are well-reproduced. The different models show some variation in the blast wave position and locations of both the maximum density and the minimum expansion parameters.
5. Discussion
5.1. Comparison of Kepler’s SNR with the models
We have argued that the kinematics, morphology, and chemical abundances in the northern shell of the type Ia SNR Kepler are best explained by a model in which the origin of the northern shell was the slow (10–20 km s-1) wind from an AGB donor star in a symbiotic binary system. The strong outflows of the donor star provide a sufficient wind luminosity, to create a >1 M⊙ shell at a distance of 2–3 pc away from the explosion center. The initial mass of the AGB star must have been 4–5 M⊙, to explain the enhanced nitrogen abundances in the northern part of the SNR. With this mass deposit of the donor star, a minimum average accretion efficiency on the order of 5–10% is required during the binary evolution to produce a type Ia SN.
The wind emanating from the system creates a bubble, which, owing to the supersonic space motion of the system (250 km s-1), is surrounded by a one-sided shell created by the bow shock. This explains both the morphology of Kepler’s SNR, and its height above the Galactic plane of 590d5 pc. In this sense, our model is reminiscent of the stellar runaway model for Kepler proposed by Bandiera (1987) and Borkowski et al. (1992), but applied to a type Ia progenitor system.
The parameters of the model are well-constrained, as the distance between the progenitor system and the wind shell depends on a combination of the spatial velocity, wind velocity, mass-loss rate, and ISM density (Eq. (2), Fig. 2). An extra constraint is that the wind velocity should be high enough to allow for the creation of the shell within the lifetime of the AGB phase (Eq. (1)).
We tested our model with several hydrodynamic simulations of both the creation of the stellar wind bubble and the subsequent SNR evolution, by varying the spatial velocity, the wind velocity, and mass loss rate. Since there is some uncertainty in the distance to Kepler, hence the size of the wind shell, we also included two models (model D and Dsub), resulting in a stagnation point at 2 pc instead of 3 pc.
All models reproduce the overall characteristics of Kepler; they have one-sided shells, and the expansion parameter of the SNR inside this dense shell drops to m = 0.3 − 0.4, in agreement with observations (Dickel et al. 1988; Vink 2008; Katsuda et al. 2008). An exception is model D. This model has the stagnation point of the wind at 2 pc, which is relevant to a distance of Kepler of ~4 kpc. The shock of the SNR has moved completely through the dense shell after 400 yr, and has an expansion parameter of m > 0.7, which is inconsistent with the observations. In this case, to match the model with the observations, the SN explosion energy has to be E = 0.2 × 1051 erg (model Dsub). Since normal SNe Ia have explosion energies in excess of 1051 erg (Woosley et al. 2007) and given the high iron content1 and historical light curve (Baade 1943), SN 1604 must have been a fairly normal type Ia. Our models are therefore most consistent with the larger distance estimate of Kepler, d ≈ 6 kpc.
Although the overall morphology and kinematics of Kepler can be reproduced, there are some interesting differences among the models. The most notable is that in model A the blast wave has just emerged out of the shell near the stagnation point. The question is now whether this is also true for Kepler.
Non-radiative shocks associated with fast shocks in low density gas are more prevalent toward the north (Sankrit et al. 2005). The presence of X-ray synchrotron radiation (blue in Fig. 1) requires fast shock velocities ( ≳ 2000 km s-1, e.g. Zirakashvili & Aharonian 2007). This perhaps suggests that the shock has picked up speed by having penetrated the shell in the northern region. In addition, the Hα images display a much thinner region of the emission due north than both the rest of the “shell” and the X-ray images. This could be because in the ISM, hydrogen is completely ionized and no Balmer shocks can be expected beyond the shell. However, to draw a firm conclusion based on this feature, a more detailed comparison between the X-ray and Hα images is required. Although, in our view, model A seems to reproduce Kepler’s SNR the best, slight adjustments to the parameters of models B and C may also result in a blast wave extending just beyond the shell. Additional asymmetries in the real Kepler system may lead to an offset of the region where the blast wave has penetrated the shell with respect to the direction of the spatial velocity.
Finally, we point out that the SNR shell in the models is thinner in the direction of the systemic motion than in the opposite direction. This also results in ejecta being closer to the shock front, as, indeed, seems to be the case in Kepler (Cassam-Chenaï et al. 2004). A similar situation seems to arise in Tycho’s SNR, where the proximity of the ejecta to the shock front has been attributed to a change in the effective equation of state as a result of efficient cosmic ray acceleration (Warren et al. 2005). Our simulations, however, can explain this, at least partially, based on pure hydrodynamics alone (cf. Kosenko et al. 2010).
5.2. On the current appearance of the donor star
The symbiotic binary model that we advocate here for Kepler has some interesting consequences for the current state of the donor star. To date, the identification of a donor star of a historical supernova has only been claimed for Tycho/SN 1572 (Ruiz-Lapuente 2004), which was mainly based on its large proper motion. However, this result is still debated, since the large proper motion of the candidate star is not accompanied by a high spin velocity as would be expected for close Roche-lobe overflowing binary progenitors (Kerzendorf et al. 2009). In our model, no such high orbital and spin velocities are expected for the donor star because we require a wide symbiotic binary. It should nonetheless maintain the high spatial velocity of the progenitor system of ~250 km s-1, something that constitutes a clear signature of its identification.
The donor star of Kepler is expected to be, according to our model, an AGB star with an initial mass of 4–5 M⊙, which has lost almost its entire envelope as a consequence of the mass transfer and the subsequent collision with the blast wave of the supernova (Marietta et al. 2000). After the collision and the mass stripping effect, the donor star adjusts its radius to re-establish its thermal equilibrium. Stars with convective envelopes are characterized by short thermal timescales, which means that the donor star has most likely already attained its original size. In this case, the donor star should be an evolved star with a bolometric luminosity similar to that of an AGB star with an initial mass of 4–5 M⊙. This is because a giant’s luminosity is mainly determined by the mass of the core, which remained unaffected by the collision. We therefore expect an absolute magnitude of MV = −4.5 ± 0.5, which at a distance of 6 kpc and AV = 2.8 (Reynolds et al. 2007) implies an apparent magnitude of mV = 12.0 ± 0.5. Due to the mass loss, the surface gravity of the donor must be lower than that of a 4–5 M⊙ AGB star and perhaps the remaining envelope has picked up ejecta material with elevated abundances of iron and intermediate mass elements (Si, S, Ar, Ca).
However, further investigation is needed before a firm conclusion can be drawn about the present-day characteristics of the donor star, as it may still be at the re-equilibration phase. In this case, the star may be either overluminous or underluminous depending on the mass of the stripped layers and the energy deposited at the remaining layers of the donor star by the collision with the SNR (Podsiadlowski 2003).
A final possibility is that the donor star has lost its entire envelope. In this case, the donor’s remnant should be a massive (~0.8 M⊙), young CO white dwarf.
5.3. Is the progenitor system of SN1604 typical of type Ia supernovae?
The model outlined here is specifically intended to explain many characteristics of Kepler’s SNR. Nevertheless, given the many problems surrounding conventional models for type Ia progenitors (see the Introduction), it is worthwhile to discuss whether our model could be more widely applicable than just to this historical SN.
The progenitor system in our model is a symbiotic binary consisting of a CO WD and a AGB star during the last phase of its evolution. This progenitor system is not a conventional progenitor in the rich literature of type Ia SNe. This is because RLOF is prone to unstable mass transfer, whereas wind accretion is characterized by low accretion efficiencies (≤10%), making it difficult to evolve toward a type Ia event. However, the mass transfer process in these systems is currently still far from being understood. The Bondi-Hoyle model that is generally used to describe the wind accretion is rather simplified and not applicable to slow winds (Edgar 2004), while for the case of RLOF a sharp stellar rim is assumed, which is not applicable to giant stars. Mohamed & Podsiadlowski (2007) simulated the Mira system and show that the mass transfer process is between that of a RLOF and wind accretion, where the accretion efficiencies are much higher than these of the Bondi-Hoyle description.
Observations already seem to reveal symbiotic systems with AGB donor stars, which, despite their large separation, show evidence of substantial hydrogen burning at the WD surface (Mira AB: Karovska et al. 2004; V 407 Cyg: Mikołajewska 2012). Interestingly, these two systems reveal some similar characteristics with our model for the progenitor of SN 1604. Mira AB shows the presence of a bow shock structure and a relatively high spatial velocity of ~130 km s-1(Matthews et al. 2008), while the lithium lines that were observed in the spectrum of V407 Cyg indicate that the donor is a HBB AGB star (Tatarnikova et al. 2003). Finally, two type Ia SN, SN 2002ic (Hamuy et al. 2003) and SN 2005gj (Aldering et al. 2006), display spectroscopical evidence of a strong interaction between the ejecta and a dense CSM originating from an AGB wind.
The accreting WD in our model is enshrouded by the dense wind from the donor. The column density towards the WD in such a case is given by 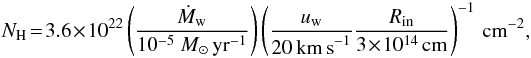 with Rin corresponding to the separation of donor star and WD. Even for a mass-loss rate of Ṁw = 3 × 10⁻⁶ M⊙ yr-1, we still have NH = 1022 cm-2, which is sufficient to attenuate the UV/X-ray flux by a factor 104 (based on the absorption model of Wilms et al. 2000). This does not only explain the lack of extended HII regions around young, nearby type Ia SNRs, but also suggests that the progenitors of SNe Ia may not necessarily be detectable in X-rays. This solves two major problems with the SD model of a Roche lobe overflowing donor star and an accreting WD. Owing to the resulting absorption of the UV/X-ray flux, it can explain the lack of extended HII regions around young nearby type Ia SNRs (Ghavamian et al. 2003) and the lack of the X-ray emission expected from accreting WDs in elliptical and spiral galaxies (Gilfanov & Bogdán 2010; Di Stefano 2010, respectively). Finally, this absorption may also significantly reduce the X-ray/UV flux originating from the collision of the blast wave with the donor star, as predicted by Kasen (2010).
One could test whether non-conservative mass transfer is more common in type Ia progenitors by looking for signatures of CSM shells in other SNRs. Even if most other systems have much more modest spatial velocities than that of SN 1604, aspherical shells can easily be created. Several type Ia SNRs indeed appear to have an axis of symmetry, and to experience a density enhancement in one direction. Two examples are Tycho’s SNR (SN1572), which has a lower expansion velocity in the east (Katsuda et al. 2010), and SN 1006, which is very symmetric in the northeast/southwest direction, but has a higher density in the northwest. Additional evidence of an interaction between SNe Ia and non-spherically symmetric CSM material is provided by X-ray observations of the Large Magellanic Cloud SNRs DEM L238 and DEM L249 (Borkowski et al. 2006).
6. Conclusions
We have presented evidence that the observational characteristics of the type Ia SNR Kepler/SN1604 can be reproduced most closely by a moving progenitor system, in which the AGB donor star forms a wind-blown bubble, while at the same time the WD accretes part of the wind up to a mass of 1.38 M⊙. Due to the spatial velocity the wind bubble is surrounded by an asymmetric shell, reaching its highest densities in the direction of the motion of the progenitor. To explain the nitrogen abundance in the northern shell of Kepler, the donor star probably had an main-sequence mass of 4–5 M⊙, which are known to have nitrogen-rich envelopes in the AGB phase.
We have used hydrodynamic simulations to show that the wind properties of the system can explain the observational characteristics of Kepler, namely a one-sided shell with which the SNR is interacting and a slower expansion velocity in that region.
Our simulations show that in the direction of the progenitor’s velocity the SNR blast wave may just have completely penetrated the wind blown shell, or still be inside it. On the basis of the possible X-ray synchrotron radiation in the north of Kepler, the lack of it from adjacent regions, and the absence of nitrogen-rich knots from that direction, we argue that in Kepler part of the blast wave may indeed have penetrated all the way through the shell. However, the presence of Balmer-dominated shocks indicate that at least part of the blast wave must still be within the cool, neutral, wind shell.
Our results also show that the distance to Kepler is likely to be around 6 kpc. This value is still within the measurement errors of  kpc (Sankrit et al. 2005) but is also in agreement with model-dependent estimates based on the absence of gamma-ray emission (Berezhko et al. 2006; Aharonian et al. 2008) and the kinematics of Kepler (Vink 2008). However, a distance of 4 kpc can be reconciled with the simulations if the explosion energy was 2 × 1050 erg. This would make SN 1604 a subenergetic explosion, which seems unlikely given its historical light curve and the copious amount of Fe present in the SNR. According to our scenario, the donor star should still be present within the SNR. It is likely to be an evolved star from which most of its envelope mass has been stripped.
For the pre-supernova appearance of the system, the large absorption column blocks out most of the X-rays from the accreting WD. These systems would, therefore, be classified as symbiotic binaries, and not as supersoft sources. This also explains the presence of neutral hydrogen near young type Ia SNRs, which cannot be present around supersoft sources owing to their high X-ray/UV flux (Ghavamian et al. 2003).
Another consequence of the model, if it is more widely applicable to type Ia progenitors, is that many SNRs should be interacting with one-sided shells. For Tycho’s SNR this could explain the low expansion parameter in the east, and even, at least partially, the proximity of the ejecta close to the forward shock, an observational characteristic usually attributed to the presence of cosmic rays (Warren et al. 2005).
In the context of a type Ia supernova explosion, Kepler’s SNR requires special circumstances regarding its dependence on a runaway binary and interaction with substantial amounts of nitrogen-rich material. A major question remains whether SN 1604 was a very special event with an unusual progenitor history and thus should be studied as a unique case, or whether some characteristics are typical of SNe Ia in general. In the second case, Kepler’s SNR may help to provide important insight into the evolution of type Ia SNe.
Even if the iron mass of Kepler’s SNR is as low as 0.2 M⊙(the lower limit of Kinugasa & Tsunemi 1999) and the total mass burnt to silicon and heavier elements is 1 M⊙ (the lower range to be considered according to Woosley et al. 2007), then the explosion energy must have been at least 0.8 × 1051 erg according to Eq. (1) of Woosley et al. (2007).
Acknowledgments
We are grateful to Arend-Jan Poelarends, Onno Pols, Joke Claeys, and Selma de Mink for many helpful discussions on the topics of stellar and binary stars evolution. In addition, we thank Rony Keppens for providing us with the AMRVAC code. We thank Frank Verbunt, Rony Keppens, and Brian Reville for their helpful suggestions that have helped us improve the manuscript. This work is supported by a Vidi grant from the Netherlands Organization for Scientific Research (NWO).
References
- Aharonian, F., Akhperjanian, A. G., Barres de Almeida, U., et al. 2008, A&A, 488, 219 [NASA ADS] [CrossRef] [EDP Sciences] [Google Scholar]
- Aldering, G., Antilogus, P., Bailey, S., et al. 2006, ApJ, 650, 510 [NASA ADS] [CrossRef] [Google Scholar]
- Baade, W. 1943, ApJ, 97, 119 [NASA ADS] [CrossRef] [Google Scholar]
- Badenes, C., Hughes, J. P., Bravo, E., & Langer, N. 2007, ApJ, 662, 472 [NASA ADS] [CrossRef] [Google Scholar]
- Bandiera, R. 1987, ApJ, 319, 885 [NASA ADS] [CrossRef] [Google Scholar]
- Bandiera, R., & van den Bergh, S. 1991, ApJ, 374, 186 [NASA ADS] [CrossRef] [Google Scholar]
- Berezhko, E. G., Ksenofontov, L. T., & Völk, H. J. 2006, A&A, 452, 217 [NASA ADS] [CrossRef] [EDP Sciences] [Google Scholar]
- Blair, W. P., Long, K. S., & Vancura, O. 1991, ApJ, 366, 484 [NASA ADS] [CrossRef] [Google Scholar]
- Blair, W. P., Ghavamian, P., Long, K. S., et al. 2007, ApJ, 662, 998 [NASA ADS] [CrossRef] [Google Scholar]
- Borkowski, K. J., Blondin, J. M., & Sarazin, C. L. 1992, ApJ, 400, 222 [NASA ADS] [CrossRef] [Google Scholar]
- Borkowski, K. J., Hendrick, S. P., & Reynolds, S. P. 2006, ApJ, 652, 1259 [NASA ADS] [CrossRef] [Google Scholar]
- Cassam-Chenaï, G., Decourchelle, A., Ballet, J., et al. 2004, A&A, 414, 545 [NASA ADS] [CrossRef] [EDP Sciences] [Google Scholar]
- Chen, X., Han, Z., & Tout, C. A. 2011, ApJ, 735, L31 [NASA ADS] [CrossRef] [Google Scholar]
- Chevalier, R. A. 1982, ApJ, 258, 790 [Google Scholar]
- Claeys, J. S. W., Pols, O. R., Vink, J., & Izzard, R. G. 2010, in AIP Conf. Ser. 1314, ed. V. Kologera, & M. van der Sluys, 262 [Google Scholar]
- de Plaa, J., Werner, N., Bleeker, J. A. M., et al. 2007, A&A, 465, 345 [NASA ADS] [CrossRef] [EDP Sciences] [Google Scholar]
- Di Stefano, R. 2010, ApJ, 712, 728 [NASA ADS] [CrossRef] [Google Scholar]
- Dickel, J. R., Sault, R., Arendt, R. G., Korista, K. T., & Matsui, Y. 1988, ApJ, 330, 254 [NASA ADS] [CrossRef] [Google Scholar]
- Edgar, R. 2004, New Astron. Rev., 48, 843 [NASA ADS] [CrossRef] [Google Scholar]
- Garnavich, P. M., Jha, S., Challis, P., et al. 1998, ApJ, 509, 74 [NASA ADS] [CrossRef] [Google Scholar]
- Ghavamian, P., Rakowski, C. E., Hughes, J. P., & Williams, T. B. 2003, ApJ, 590, 833 [NASA ADS] [CrossRef] [Google Scholar]
- Gies, D. R., & Bolton, C. T. 1986, ApJS, 61, 419 [NASA ADS] [CrossRef] [Google Scholar]
- Gilfanov, M., & Bogdán, Á. 2010, Nature, 463, 924 [NASA ADS] [CrossRef] [PubMed] [Google Scholar]
- Green, D. A., & Stephenson, F. R. 2003, in Supernovae and Gamma-Ray Bursters, ed. K. Weiler, Lect. Notes Phys., 598, 7 [Google Scholar]
- Habing, H. J., & Olofsson, H., 2003, Asymptotic giant branch stars (Springer) [Google Scholar]
- Hachisu, I., & Kato, M. 2001, ApJ, 558, 323 [NASA ADS] [CrossRef] [Google Scholar]
- Hachisu, I., Kato, M., & Nomoto, K. 1996, ApJ, 470, L97 [NASA ADS] [CrossRef] [Google Scholar]
- Hachisu, I., Kato, M., & Nomoto, K. 1999, ApJ, 522, 487 [NASA ADS] [CrossRef] [Google Scholar]
- Hachisu, I., Kato, M., & Nomoto, K. 2008, ApJ, 679, 1390 [Google Scholar]
- Hamuy, M., Phillips, M. M., Suntzeff, N. B., et al. 2003, Nature, 424, 651 [NASA ADS] [CrossRef] [Google Scholar]
- Hillebrandt, W., & Niemeyer, J. C. 2000, ARA&A, 38, 191 [NASA ADS] [CrossRef] [Google Scholar]
- Huang, R. Q., & Weigert, A. 1982, A&A, 116, 348 [NASA ADS] [Google Scholar]
- Hughes, J. P., Hayashi, I., Helfand, D., et al. 1995, ApJ, 444, L81 [NASA ADS] [CrossRef] [Google Scholar]
- Hughes, J. P., Chugai, N., Chevalier, R., Lundqvist, P., & Schlegel, E. 2007, ApJ, 670, 1260 [NASA ADS] [CrossRef] [Google Scholar]
- Iben, Jr., I., & Tutukov, A. V. 1984, ApJS, 54, 335 [NASA ADS] [CrossRef] [Google Scholar]
- Karakas, A., & Lattanzio, J. C. 2007, Publ. Astron. Soc. Aust., 24, 103 [Google Scholar]
- Karovska, M., Wood, B., Marengo, M., et al. 2004, in Rev. Mex. Astron. Astrofis. Conf. Ser. 20, ed. G. Tovmassian, & E. Sion, 92 [Google Scholar]
- Kasen, D. 2010, ApJ, 708, 1025 [NASA ADS] [CrossRef] [Google Scholar]
- Katsuda, S., Petre, R., Hughes, J. P., et al. 2010, ApJ, 709, 1387 [NASA ADS] [CrossRef] [Google Scholar]
- Katsuda, S., Tsunemi, H., Uchida, H., & Kimura, M. 2008, ApJ, 689, 225 [NASA ADS] [CrossRef] [Google Scholar]
- Keppens, R., Nool, M., Tóth, G., & Goedbloed, J. P. 2003, Comp. Phys. Commun., 153, 317 [Google Scholar]
- Kerzendorf, W. E., Schmidt, B. P., Asplund, M., et al. 2009, ApJ, 701, 1665 [NASA ADS] [CrossRef] [Google Scholar]
- Kinugasa, K., & Tsunemi, H. 1999, PASJ, 51, 239 [NASA ADS] [CrossRef] [Google Scholar]
- Kosenko, D., Helder, E. A., & Vink, J. 2010, A&A, 519, A11 [NASA ADS] [CrossRef] [EDP Sciences] [Google Scholar]
- Leonard, P. J. T., & Duncan, M. J. 1990, AJ, 99, 608 [NASA ADS] [CrossRef] [Google Scholar]
- Livio, M. 2000, in Type Ia Supernovae, Theory and Cosmology, ed. J. C. Niemeyer, & J. W. Truran, 33 [Google Scholar]
- Livio, M., & Truran, J. W. 1992, ApJ, 389, 695 [NASA ADS] [CrossRef] [Google Scholar]
- Mannucci, F., Della Valle, M., & Panagia, N. 2006, MNRAS, 370, 773 [NASA ADS] [CrossRef] [Google Scholar]
- Maoz, D. 2008, MNRAS, 384, 267 [NASA ADS] [CrossRef] [Google Scholar]
- Marietta, E., Burrows, A., & Fryxell, B. 2000, ApJS, 128, 615 [NASA ADS] [CrossRef] [Google Scholar]
- Martin, J. C. 2006, AJ, 131, 3047 [NASA ADS] [CrossRef] [Google Scholar]
- Matthews, L. D., Libert, Y., Gérard, E., Le Bertre, T., & Reid, M. J. 2008, ApJ, 684, 603 [NASA ADS] [CrossRef] [Google Scholar]
- Mattila, S., Lundqvist, P., Sollerman, J., et al. 2005, A&A, 443, 649 [NASA ADS] [CrossRef] [EDP Sciences] [Google Scholar]
- McKee, C. F., & Ostriker, J. P. 1977, ApJ, 218, 148 [NASA ADS] [CrossRef] [Google Scholar]
- McSwain, M. V., Boyajian, T. S., Grundstrom, E. D., & Gies, D. R. 2007a, ApJ, 655, 473 [NASA ADS] [CrossRef] [Google Scholar]
- McSwain, M. V., Ransom, S. M., Boyajian, T. S., Grundstrom, E. D., & Roberts, M. S. E. 2007b, ApJ, 660, 740 [NASA ADS] [CrossRef] [Google Scholar]
- Mikołajewska, J. 2012, in Binary Paths to Type Ia Supernovae, ed. R. Di Stefano, & M. Orio (Cambridge University Press), IAU Symp., 281, in press [arXiv:1110.1847] [Google Scholar]
- Mohamed, S., & Podsiadlowski, P. 2007, in 15th European Workshop on White Dwarfs, ed. R. Napiwotzki, & M. R. Burleigh, ASP Conf. Ser., 372, 397 [Google Scholar]
- Nomoto, K. 1982, ApJ, 253, 798 [NASA ADS] [CrossRef] [Google Scholar]
- Nomoto, K., & Kondo, Y. 1991, ApJ, 367, L19 [NASA ADS] [CrossRef] [Google Scholar]
- Pakmor, R., Kromer, M., Röpke, F. K., et al. 2010, Nature, 463, 61 [NASA ADS] [CrossRef] [PubMed] [Google Scholar]
- Panagia, N., Van Dyk, S. D., Weiler, K. W., et al. 2006, ApJ, 646, 369 [NASA ADS] [CrossRef] [Google Scholar]
- Patat, F., Chandra, P., Chevalier, R., et al. 2007, Science, 317, 924 [NASA ADS] [CrossRef] [EDP Sciences] [PubMed] [Google Scholar]
- Perlmutter, S., Aldering, G., della Valle, M., et al. 1998, Nature, 391, 51 [CrossRef] [Google Scholar]
- Phillips, M. M., Wells, L. A., Suntzeff, N. B., et al. 1992, AJ, 103, 1632 [NASA ADS] [CrossRef] [Google Scholar]
- Podsiadlowski, P. 2003, unpublished [arXiv:astro-ph/0303660] [Google Scholar]
- Reimers, D. 1975, Mem. Soc. Roy. Sci. Liège, 8, 369 [Google Scholar]
- Reynolds, R. J. 1991, in The Interstellar Disk-Halo Connection in Galaxies, ed. H. Bloemen, IAU Symp., 144, 67 [Google Scholar]
- Reynolds, S. P., Borkowski, K. J., Hwang, U., et al. 2007, ApJ, 668, L135 [NASA ADS] [CrossRef] [Google Scholar]
- Reynoso, E. M., & Goss, W. M. 1999, AJ, 118, 926 [NASA ADS] [CrossRef] [Google Scholar]
- Ruiter, A. J., Belczynski, K., & Fryer, C. 2009, ApJ, 699, 2026 [NASA ADS] [CrossRef] [Google Scholar]
- Ruiz-Lapuente, P. 2004, ApJ, 612, 357 [NASA ADS] [CrossRef] [Google Scholar]
- Saio, H., & Nomoto, K. 1985, A&A, 150, L21 [NASA ADS] [Google Scholar]
- Sankrit, R., Blair, W. P., Delaney, T., et al. 2005, Adv. Space Res., 35, 1027 [NASA ADS] [CrossRef] [Google Scholar]
- Schure, K. M., Kosenko, D., Kaastra, J. S., Keppens, R., & Vink, J. 2009, A&A, 508, 751 [NASA ADS] [CrossRef] [EDP Sciences] [Google Scholar]
- Smith, A., Peacock, A., Arnaud, M., et al. 1989, ApJ, 347, 925 [NASA ADS] [CrossRef] [Google Scholar]
- Sollerman, J., Ghavamian, P., Lundqvist, P., & Smith, R. C. 2003, A&A, 407, 249 [NASA ADS] [CrossRef] [EDP Sciences] [Google Scholar]
- Sternberg, A., Gal-Yam, A., Simon, J. D., et al. 2011, Science, 333, 856 [NASA ADS] [CrossRef] [Google Scholar]
- Taam, R. E., & Ricker, P. M. 2010, New Astron. Rev., 54, 65 [NASA ADS] [CrossRef] [Google Scholar]
- Tatarnikova, A. A., Marrese, P. M., Munari, U., et al. 2003, MNRAS, 344, 1233 [NASA ADS] [CrossRef] [Google Scholar]
- Tucker, B. E. 2011, Ap&SS, 40 [Google Scholar]
- Vassiliadis, E., & Wood, P. R. 1993, ApJ, 413, 641 [NASA ADS] [CrossRef] [Google Scholar]
- Velázquez, P. F., Vigh, C. D., Reynoso, E. M., Gómez, D. O., & Schneiter, E. M. 2006, ApJ, 649, 779 [NASA ADS] [CrossRef] [Google Scholar]
- Vink, J. 2008, ApJ, 689, 231 [NASA ADS] [CrossRef] [Google Scholar]
- Warren, J. S., Hughes, J. P., Badenes, C., et al. 2005, ApJ, 634, 376 [NASA ADS] [CrossRef] [Google Scholar]
- Weidemann, V. 2000, A&A, 363, 647 [NASA ADS] [Google Scholar]
- Wilms, J., Allen, A., & McCray, R. 2000, ApJ, 542, 914 [NASA ADS] [CrossRef] [Google Scholar]
- Woosley, S. E., Kasen, D., Blinnikov, S., & Sorokina, E. 2007, ApJ, 662, 487 [NASA ADS] [CrossRef] [Google Scholar]
- Yungelson, L. R., & Livio, M. 2000, ApJ, 528, 108 [CrossRef] [Google Scholar]
- Zirakashvili, V. N., & Aharonian, F. 2007, A&A, 465, 695 [NASA ADS] [CrossRef] [EDP Sciences] [Google Scholar]
All Tables
The production factor and the chemical abundances as a function of the stellar (initial) mass of an AGB star of solar metallicity (Karakas & Lattanzio 2007).
All Figures
|
Fig. 1 Chandra X-ray image of Kepler’s SNR, with red indicating Si-Kα emission (1.75–1.95 keV), green Fe-L emission (0.8–1.6 keV), and blue continuum emission (4–6 keV). The image is based on a deep, 750 ks, Chandra observation (Reynolds et al. 2007). |
| In the text | |
|
Fig. 2 The mass loss rates versus the wind velocity of the AGB star for values satisfying r0 = 2 pc and r0 = 3 pc for nism = 0.5 × 10⁻³ cm-3 and u∗ = 250 km s-1. |
| In the text | |
|
Fig. 3 The 2D density profile of the simulation of the bow-shocked wind bubble. The mass-losing star is located in the origin where we allow a radial wind flow to enter the grid. Isotropic, homogeneous gas simultaneously enters the grid antiparallel to the y-axis, which represents the motion of the ISM in the star’s rest frame. The arrows correspond to the vectors of the momentum of each flow. |
| In the text | |
|
Fig. 4 The evolution of the wind bubble of model A. The snapshots from left to right correspond to the times 0.10 Myr, 0.29 Myr, 0.38 Myr, and 0.57 Myr. |
| In the text | |
|
Fig. 5 SNR evolution of model A. The snapshots from left to right correspond to the times 158 yr, 285 yr, 349 yr, and 412 yr. |
| In the text | |
|
Fig. 6 Model A SNR properties at 412 yr. From left to right: density, expansion parameter, pressure, and temperature. |
| In the text | |
|
Fig. 7 Model A blast wave properties. The upper plot shows the position (solid lines) and the velocity (dotted lines) of the shock versus the time. The lower plot displays the evolution of the expansion parameter. The black color (lower lines) corresponds to the azimuthal angle of 0°, while the red (upper lines) represents 180°. |
| In the text | |
|
Fig. 8 Comparison of the four models of the wind shells. The plots from left to right correspond to model A, B, C, and D (the bubble for model Dsub is the same as the one for model D). |
| In the text | |
|
Fig. 9 Comparison of the density and the expansion parameter of the five models, from left to right corresponding to: A, B, C, D, and Dsub. The upper row shows the density of the remnant. The lower panels show the expansion parameter. |
| In the text | |
Current usage metrics show cumulative count of Article Views (full-text article views including HTML views, PDF and ePub downloads, according to the available data) and Abstracts Views on Vision4Press platform.
Data correspond to usage on the plateform after 2015. The current usage metrics is available 48-96 hours after online publication and is updated daily on week days.
Initial download of the metrics may take a while.